Scarce Resources vs. Unlimited Wants
advertisement
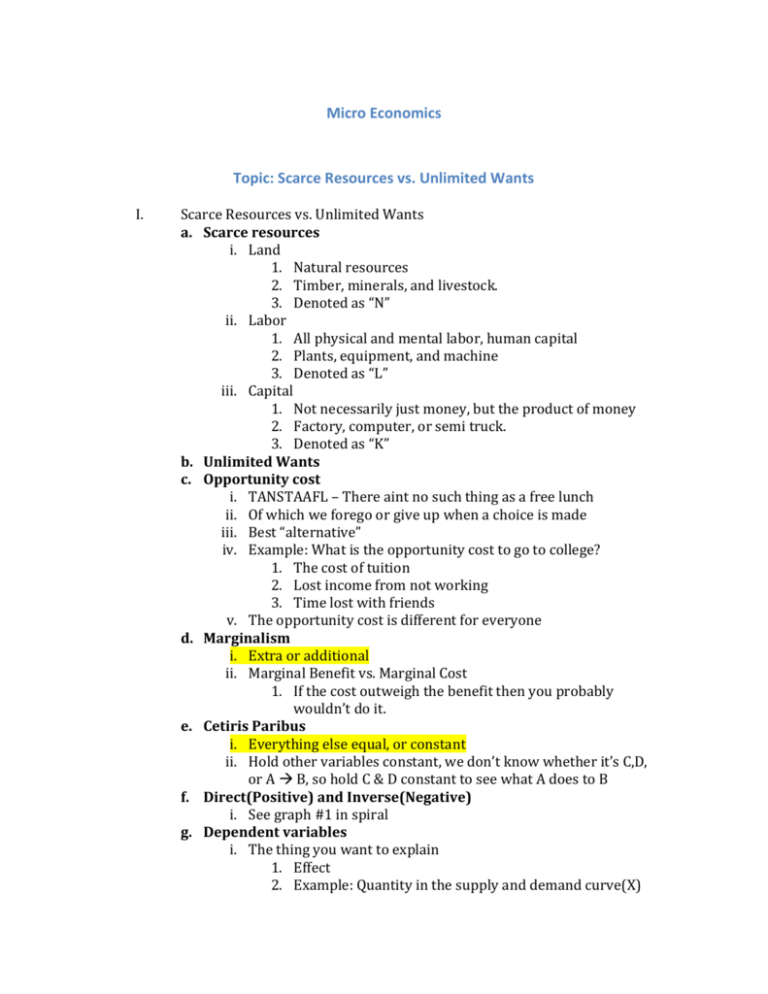
Micro Economics Topic: Scarce Resources vs. Unlimited Wants I. Scarce Resources vs. Unlimited Wants a. Scarce resources i. Land 1. Natural resources 2. Timber, minerals, and livestock. 3. Denoted as “N” ii. Labor 1. All physical and mental labor, human capital 2. Plants, equipment, and machine 3. Denoted as “L” iii. Capital 1. Not necessarily just money, but the product of money 2. Factory, computer, or semi truck. 3. Denoted as “K” b. Unlimited Wants c. Opportunity cost i. TANSTAAFL – There aint no such thing as a free lunch ii. Of which we forego or give up when a choice is made iii. Best “alternative” iv. Example: What is the opportunity cost to go to college? 1. The cost of tuition 2. Lost income from not working 3. Time lost with friends v. The opportunity cost is different for everyone d. Marginalism i. Extra or additional ii. Marginal Benefit vs. Marginal Cost 1. If the cost outweigh the benefit then you probably wouldn’t do it. e. Cetiris Paribus i. Everything else equal, or constant ii. Hold other variables constant, we don’t know whether it’s C,D, or A B, so hold C & D constant to see what A does to B f. Direct(Positive) and Inverse(Negative) i. See graph #1 in spiral g. Dependent variables i. The thing you want to explain 1. Effect 2. Example: Quantity in the supply and demand curve(X) h. Independent variables i. The thing that does the explaining 1. Cause 2. Use this as an example 3. Example: Price in the supply and demand curve(Y) i. Production Possibilities i. Shows the various combinations of 2 goods which can be produced, given a society’s resources and level of technology ii. Fixed number of resources iii. Fixed level of technology iv. All resources are fully and efficiently utilized j. Guns v Butter i. Defense versus non-defense spending 1. Example: 70s war in Asia, etc. One dollar spent on national defense is one dollar less spent on food ii. Chart iii. Graph the table above 6 5 Amount 4 Column2 Series 3 3 Series 4 Series 5 2 Series 6 1 0 iv. 1. Guns Butter Guns Butter 5 0 4 1 3 2 2 3 1 4 0 5
