PS Unit 5 Homework Handout
advertisement
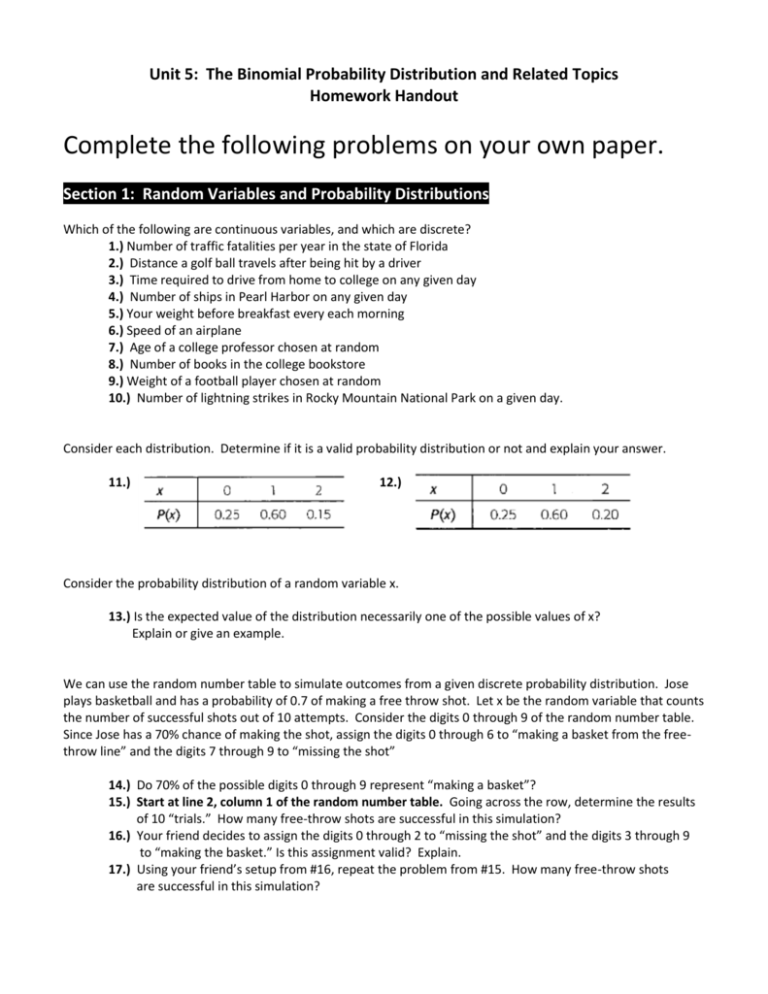
Unit 5: The Binomial Probability Distribution and Related Topics Homework Handout Complete the following problems on your own paper. Section 1: Random Variables and Probability Distributions Which of the following are continuous variables, and which are discrete? 1.) Number of traffic fatalities per year in the state of Florida 2.) Distance a golf ball travels after being hit by a driver 3.) Time required to drive from home to college on any given day 4.) Number of ships in Pearl Harbor on any given day 5.) Your weight before breakfast every each morning 6.) Speed of an airplane 7.) Age of a college professor chosen at random 8.) Number of books in the college bookstore 9.) Weight of a football player chosen at random 10.) Number of lightning strikes in Rocky Mountain National Park on a given day. Consider each distribution. Determine if it is a valid probability distribution or not and explain your answer. 11.) 12.) Consider the probability distribution of a random variable x. 13.) Is the expected value of the distribution necessarily one of the possible values of x? Explain or give an example. We can use the random number table to simulate outcomes from a given discrete probability distribution. Jose plays basketball and has a probability of 0.7 of making a free throw shot. Let x be the random variable that counts the number of successful shots out of 10 attempts. Consider the digits 0 through 9 of the random number table. Since Jose has a 70% chance of making the shot, assign the digits 0 through 6 to “making a basket from the freethrow line” and the digits 7 through 9 to “missing the shot” 14.) Do 70% of the possible digits 0 through 9 represent “making a basket”? 15.) Start at line 2, column 1 of the random number table. Going across the row, determine the results of 10 “trials.” How many free-throw shots are successful in this simulation? 16.) Your friend decides to assign the digits 0 through 2 to “missing the shot” and the digits 3 through 9 to “making the basket.” Is this assignment valid? Explain. 17.) Using your friend’s setup from #16, repeat the problem from #15. How many free-throw shots are successful in this simulation? (Section 1 Homework problems, continued) What is the income distribution of super shoppers? In the following table, income units are in thousands of dollars, and each interval goes up but does not include the given high value. The midpoints are given to the nearest dollars. 18.) Using the income midpoints x and the percent of super shoppers, do we have a valid probability distribution? Explain. 19.) Use a histogram to graph the probability distribution from #18. 20.) Compute the expected income μ of a super shopper. 21.) Compute the standard deviation σ for the income of super shoppers. The following data are based on information taken from Daily Creel Summary, published by the Paiute Indian Nation, Pyramid Lake, Nevada. Movie stars and U.S. presidents have fished Pyramid Lake. It is one of the best places in the lower 48 states to catch trophy cutthroat trout. In this table, x = the number of fish caught in a 6 hour period. The percentage data are the percentages of fishermen who caught x fish in a 6-hour period while fishing from shore. 22.) Convert the percentages to probabilities and make a histogram of the probability distribution. 23.) Find the probability that a fisherman selected at random fishing from shore catches one or more fish in a 6-hour period. 24.) Find the probability that a fishermen selected at random fishing from shore catches two or more fish in a 6-hour period. 25.) Compute μ , the expected value of the number of fish caught per fisherman in a 6-hour period (round 4 or more to 4). 26.) Compute σ , the standard deviation of the number of fish caught per fisherman in a 6-hour period (round 4 or more to 4). Section 2: Binomial Probability Distributions (Section 1 Review) What was the age distribution of nurses in Great Britain at the time of Florence Nightingale? Thanks to Florence Nightingale and the British census in 1851, we have the following information. Note: In 1851 there were 25,466 nurses in Great Britain. 1. Using the age midpoints x and the percent of nurses, do we have a valid probability distribution? Explain. 2. Use a histogram to graph the probability distribution. 3. Find the probability that a British nurse selected at random in 1851 would be 60 years of age or older. 4. Compute the expected age μ of a British nurse contemporary to Florence Nightingale. 5. Compute the standard deviation σ for ages of nurses shown in the distribution. USA Today reported that approximately 25% of all state prison inmates released on parole become repeat offenders while on parole. Suppose the parole board is examining five prisoners up for parole. Let x = the number of prisoners out of five on parole who become repeat offenders. 6. Find the probability that one or more of the five parolees will be repeat offenders. What is the relationship to the probability that none of the parolees will be repeat offenders? 7. Find the probability that two or more of the five parolees will be repeat offenders. 8. Find the probability that four or more of the five parolees will be repeat offenders. 9. Compute μ , the expected number of repeat offenders out of five. 10. Compute σ, the standard deviation of the number of repeat offenders out of five. Note: On the following problems answers may vary slightly depending on whether the binomial distribution formula, the binomial distribution table, or distribution results from a calculator or computer are used. Before working each problem, determine: What makes up a trial? What is a success? What is a failure? What are the values of n, p, and q ? For each of the following probabilities in #11-28, do the following: a) Use the formula for the binomial distribution to compute the requested probability. b) Look up the probability in the binomial distribution table and compare the results with the computed results. A fair quarter is flipped three times. 11. P(exactly 3 heads) 13. P(two or more heads) 12. P(exactly 2 heads) 14. P(exactly three tails) (Section 2 Continued) Before 1918, approximately 55% of the wolves in New Mexico and Arizona region were male and 45% were female. However, cattle ranchers in the area have made a determined effort to exterminate wolves. From 1918 to the present, approximately 70% of the wolves in the region are male and 30% are female. Biologists suspect that the male wolves are more likely than females to return to an area where the population has been greatly reduced. 15. Before 1918, in a random sample of 12 wolves spotted in the region, what is the probability that 6 or more were male? 16. Before 1918, in a random sample of 12 wolves spotted in the region, what is the probability that 6 or more were female? 17. Before 1918, in a random sample of 12 wolves spotted in the region, what is the probability that fewer than 4 were female? 18. Repeat #15 for 1918 to the present. 19. Repeat #16 for 1918 to the present. 20. Repeat #17 for 1918 to the present. Sociologists say that 90% of married women claim that their husband’s mother is the biggest bone of contention in their marriages (sex and money are lower-rated areas of contention). Suppose that six married women are having coffee together one morning. 21. P(all of them dislike their mother-in-law) 22. P(none of them dislike their mother-in-law) 23. P(at least four of them dislike their mother-in-law) 24. P(no more than three of them dislike their mother-in-law) Aldrich Ames is a convicted traitor who leaked American secrets to a foreign power. Yet Ames took routine lie detector tests and each time passed them. How can this be done? Recognizing control questions, employing unusual breathing patterns, biting one’s own tongue at the right time, pressing one’s toes hard to the floor, and counting backwards by 7 are counter-measures that are difficult to detect but can change the result of a polygraph exam. In fact, it is reported in a book about Mr. Ames that after only 20 minutes of instruction by “Buzz” Fay (a prison inmate), 85% of those trained were able to pass the polygraph test even when guilty of a crime. Suppose that a random sample of nine students in a psychology laboratory are told a “secret” and then given instructions on how to pass the polygraph exam without revealing their knowledge of the secret. 25. 26. 27. 28. P(all the students are able to pass the polygraph test) P(more than half of the students are able to pass the polygraph test) P(no more than 4 students are able to pass the polygraph test) P(all the students are able to pass the polygraph test) Section 3: Additional Properties of Binomial Distribution (Section 1 Review) State if the following random variables are Discrete or Continuous. 1. 2. 3. 4. The number of traffic fatalities per year in the state of Florida The distance a golf ball travels after being hit with a driver The number of ships in Pearl Harbor on any given day Your weight before breakfast each morning Is the following a valid probability distribution? Explain 5. x 0 1 2 P(x) .50 .25 .01 6. x 0 1 2 P(x) .25 .70 .05 The following table shows the amount of show the number of shoppers in a specific age range for whom at least 70% or more of the items purchased were on sale or purchased with a coupon. Age Range in Years 18-28 29-39 40-50 51-61 62 + over Midpoint (x) 23 34 45 56 67 Percent of super shoppers 7% 44% 24% 14% 11% 7. Using the age midpoints x and the percentage of super shoppers, do you have a valid probability distribution? Explain. 8. Use a histogram to graph the probability distribution of #7 9. Compute the expected age μ of a super shopper. 10. Compute the standard deviation σ for ages of super shoppers. (Section 2 Review) Determine in which of the following situations a binomial distribution can be applied. If not, state which of the four conditions to satisfy the binomial distribution requirements has been violated. 11. Linda is interested in toilet paper pulling preferences. She takes a simple random sample of 5 people and asks each whether they always pull from the top or not. The probability that a person pulls from the top is 0.53, and X= the number of people who pull from the top. 12. I roll a fair, 6-sided die until I get a two. X is the number of rolls it takes before I obtain a roll of two. 13. You have a bag containing 4 red chips and 6 white chips and you draw 4 chips. Let random variable Y be the number of red chips drawn from the bag out of 4 draws without replacement. A research team at Cornell University conducted a study showing that approximately 10% of all businessmen who wear ties wear them so tightly that they actually reduce blood flow to the brain, diminishing cerebral functions. At a board meeting of 20 businessmen, all of whom wear ties. 14. 15. 16. 17. P(no tie is too tight) P(exactly 3 ties are too tight) P(at least one tie is too tight) P(two or less ties are too tight) (section 3) USA Today reported that about 20% of all people in the United States are illiterate. Suppose you take seven people at random off a city street. 18. Make a histogram showing the probability distribution of the number of illiterate people r = 0 to 7 out of seven people in the sample. 19. Describe the shape of the distribution: symmetrical, skewed left, skewed right? 20. Find the mean and standard deviation of this probability distribution. 21. What is the expected number of illiterate people in this sample? The Wall Street Journal reported that approximately 25% of people who are told a product is “improved” believe that it is, in fact, “improved”. The remaining 75% of people believe that this is just hype. Suppose a marketing study consists of a sample of eight people who are given a sales talk about a new, “improved” product. 22. Make a histogram showing the probability that r = 0 to 8 people believe the product is, in fact, improved. 23. Describe the shape of the distribution. 24. Find the mean and standard deviation of this probability distribution. 25. What is the expected number of people who will believe the product is, in fact, improved? About 25% of people called to jury duty will find an excuse such as work, poor health, travel out of town, etc. to avoid this civic duty. If 12 people are called for jury duty, 26. What is the probability that all 12 will be available to serve on the jury? 27. What is the probability that less than 7 will be available to serve on the jury? 28. Find the mean and standard deviation of this probability distribution. 29. What is the expected number of people out of the 12 that will be available to serve on the jury?

