Transpiration Lab
advertisement

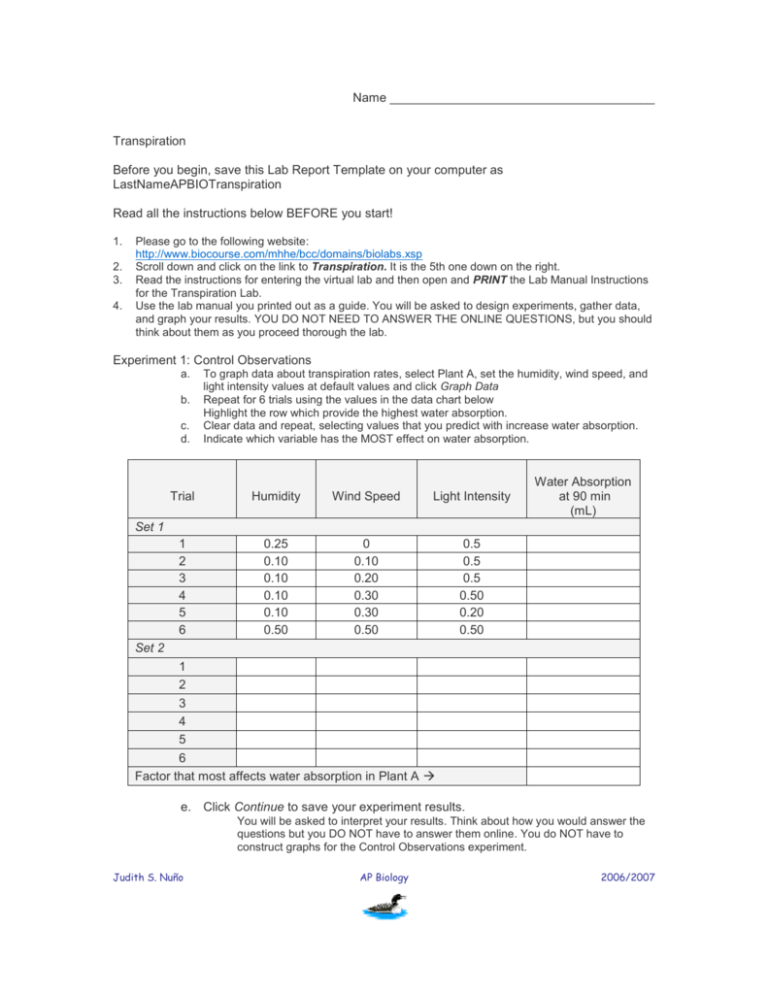
Name ______________________________________ Transpiration Before you begin, save this Lab Report Template on your computer as LastNameAPBIOTranspiration Read all the instructions below BEFORE you start! 1. 2. 3. 4. Please go to the following website: http://www.biocourse.com/mhhe/bcc/domains/biolabs.xsp Scroll down and click on the link to Transpiration. It is the 5th one down on the right. Read the instructions for entering the virtual lab and then open and PRINT the Lab Manual Instructions for the Transpiration Lab. Use the lab manual you printed out as a guide. You will be asked to design experiments, gather data, and graph your results. YOU DO NOT NEED TO ANSWER THE ONLINE QUESTIONS, but you should think about them as you proceed thorough the lab. Experiment 1: Control Observations a. b. c. d. To graph data about transpiration rates, select Plant A, set the humidity, wind speed, and light intensity values at default values and click Graph Data Repeat for 6 trials using the values in the data chart below Highlight the row which provide the highest water absorption. Clear data and repeat, selecting values that you predict with increase water absorption. Indicate which variable has the MOST effect on water absorption. Trial Humidity Wind Speed Light Intensity 1 2 3 4 5 6 0.25 0.10 0.10 0.10 0.10 0.50 0 0.10 0.20 0.30 0.30 0.50 0.5 0.5 0.5 0.50 0.20 0.50 Water Absorption at 90 min (mL) Set 1 Set 2 1 2 3 4 5 6 Factor that most affects water absorption in Plant A e. Click Continue to save your experiment results. You will be asked to interpret your results. Think about how you would answer the questions but you DO NOT have to answer them online. You do NOT have to construct graphs for the Control Observations experiment. Judith S. Nuño AP Biology 2006/2007 Experiment 2: Light Intensity a. b. c. d. e. f. Click Default Values Set Light Intensity at 1.00 Graph data Repeat with values in the data table below. After you have completed 6 trials, click Continue to go to the next screen, where you can continue determining the water absorption for the higher light intensity values. Highlight the light intensity with the highest water absorption value. Effect of Light Intensity on Water Absorption Humidity = 0.25 Wind = 0 Water Absorption Trial Light Intensity at 90 min (mL) Set 1 1 2 3 4 5 6 1.00 0.90 0.80 0.70 0.60 0.50 1 2 3 4 5 6 0.50 0.40 0.30 0.20 0.10 0.00 Set 2 Experiment 3: Humidity a. b. c. d. e. Click Default Values Set humidity at 0.75 Graph data Repeat with values in the data table below. Highlight the humidity with the highest water absorption value. Effect of Humidity on Water Absorption Wind Speed = 0.00 Light Intensity = 0.50 Water Absorption Trial Humidity at 90 min (mL) 1 0.80 2 0.70 3 0.60 4 0.50 5 0.40 6 0.30 Judith S. Nuño AP Biology 2006/2007 Experiment 4: Wind Speed a. b. c. d. e. Click Default Values Set wind at 0.80 Graph data Repeat with values in the data table below. Highlight the wind speed with the highest water absorption value. Effect of Wind Speed on Water Absorption Humidity = 0.25 Light Intensity = 0.50 Water Absorbed Trial Wind Speed (mL) 1 0.80 2 0.70 3 0.60 4 0.50 5 0.40 6 0.30 You do NOT need to complete the rest of the simulations. Discussion: a. b. c. d. e. Summarize what you did Explain how humidity, wind speed, and light intensity affect transpiration rate as measured by water absorption. Which variable has the greatest effect on plant transpiration? Propose an explanation for this result. Discuss how these factors would affect a plant with a low density and a high density of stomata. (Be sure to include a description of what stomata are!). What application might this series of experiments have for agricultural or horticultural research? Conclusion: Brief statement about the factor that has the greatest effect on transpiration Reflection: Brief comment about what you learned from this lab. Judith S. Nuño AP Biology 2006/2007


