Comparing Two Sets of Data
advertisement

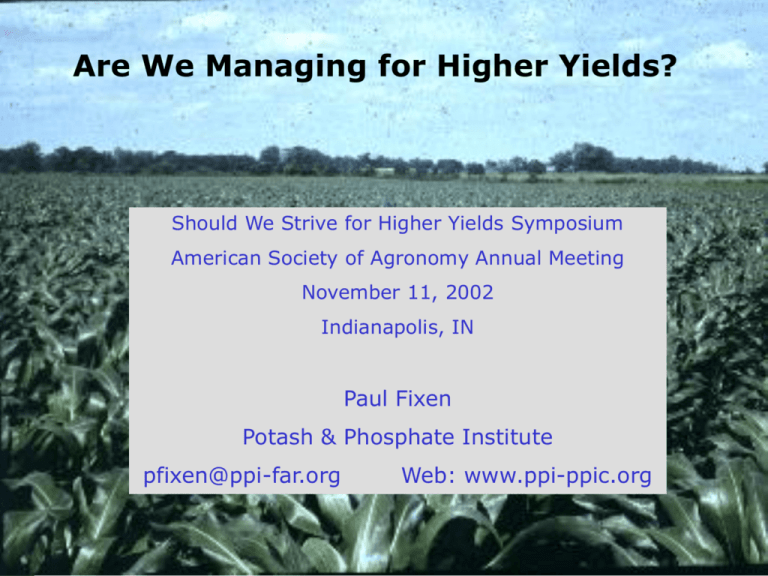
Are We Managing for Higher Yields? Should We Strive for Higher Yields Symposium American Society of Agronomy Annual Meeting November 11, 2002 Indianapolis, IN Paul Fixen Potash & Phosphate Institute pfixen@ppi-far.org Web: www.ppi-ppic.org Yield trends in the U.S. 150 130 Yield (bu/A) 120 50 Corn 1.9 bu/A/yr 45 y = 1.87x - 3610 40 Yield (bu/A) 140 110 100 90 80 30 25 We are managing for higher yields 10 50 1965 1970 1975 1980 1985 1990 1995 1960 2000 3.8 1965 1970 1975 1980 1985 1990 1995 2000 1995 2000 50 Alfalfa 52 lb/A/yr y = 0.0262x - 48.86 45 40 Yield (bu/A) Yield (tons/A) 35 15 60 3.4 y = 0.407x - 773 20 70 1960 Wheat 0.41 bu/A/yr 3.0 2.6 Soybeans 0.38 bu/A/yr y = 0.3794x - 720.97 35 30 25 20 2.2 15 10 1.8 1960 1965 1970 1975 1980 1985 1990 1995 2000 1960 1965 1970 1975 1980 1985 1990 Are we managing for attainable yields? • What yields are attainable? • A site-specific question • Highest research yields • Farmer examples – rain fed corn in IA and IL • What management practices were used to get them? • Does not tell us what was required • Does offer research direction • What practices are currently being used? Top corn yields from researchers in 1982 Dr. Roy Flannery New Jersey Dr. Sterling Olsen Colorado 338 bu/A 332 bu/A Exploitable yield potential in corn 450 H. Warsaw Saybrook, IL Corn yield, bu/A 400 F. Childs Manchester, IA 350 300 1965-1991 2.0 bu/A/yr 250 1992-2001 20.1 bu/A/yr IA Contest Winners 200 A yield gap does exist 150 100 IA State Average 50 1.6 bu/A/yr 0 1965 1970 1975 1980 1985 Year 1990 1995 2000 Herman Warsaw yield history, 1966-1985 400 Saybrook, IL Corn yield, bu/A 350 300 250 200 7.4 bu/A/yr 150 100 1965 1970 1975 Year 1980 1985 Rain fed corn yields & rainfall - Herman Warsaw Saybrook, IL 15-year average 274 bu/A Variable rainfall From Saybrook, IL to Manchester, IA: Climate Manchester, IA Growing season climate, 1971-2000 Precip Temp GDD Month Man Urbana Man Urbana Man Urbana Inches Apr May Jun Jul Aug Sep Oct Tot/Avg 3.3 3.9 4.6 4.4 5.0 3.3 2.6 27.0 3.7 4.8 4.2 4.7 4.4 3.2 2.8 27.7 F 47 59 68 72 70 61 50 61 51 62 72 75 73 66 54 65 Base 50 162 212 367 436 557 641 672 751 611 702 412 505 199 266 2980 3513 Source: Midwest Regional Climate Center Saybrook, IL From Saybrook, IL to Manchester, IA: Soils Manchester, IA Property Soil type Taxonomy Cap. Class Org. mat., % pH P1, ppm K, ppm Childs Kenyon loam Typic Hapludolls IIe 5.5-6.0 5.3-6.1 126 (VH) 374 (VH) Warsaw Parr silt loam Oxyaquic Argiudolls 5.3 6.0 81 (VH) 400 (VH) Source: Childs data – Murrell and Childs, 2000; Smith, 2000; Dobermann, 2002 Warsaw data – PPI, 1986. Saybrook, IL From Saybrook, IL to Manchester, IA: Soil OM Manchester, IA Depth, In Childs 0-6 6-12 12-18 18-24 24-30 30-36 5.6 4.5 3.0 ------- Warsaw-light Warsaw-dark Organic matter, % 5.8 4.5 4.9 3.9 3.2 4.3 1.4 4.3 0.8 3.8 0.6 3.6 Source: Childs data – Dobermann, 2002. Warsaw data – PPI, 1977. Saybrook, IL Fence row 5.2 3.7 2.7 2.3 1.5 0.9 From Saybrook, IL to Manchester, IA: Farmer attributes Manchester, IA Dedicated to a concept … but very patient • Warsaw: 20 years of intensively managed continuous corn • Childs: 35 years of intensively managed continuous corn Saybrook, IL From Saybrook, IL to Manchester, IA: Practices Manchester, IA Practice Fall tillage Hybrid Harv. Population Row spacing Manure Childs Mini MP 14” deep Pioneer 34M95 34,000 - 40,000 30” Historical high rates Fall P2O5+K2O 180+120 (99, not 01) Fall N, lb/A 50(UAN) Preplant N 250(NH3 + sep. stab.) Starter, N+P2O5+K2O 6+15+15 Postplant N 50(UAN) 3.5-4’ tall N 50(UAN+Guardian) Fert N, lb/A 406 (1.0 bu/lb) Other nutrients Boron Warsaw CH 14” deep FS 854 36,000 28” 20 T/A annually 250+250 45(DAP) 300(UAN)+ 100(AS) 26+26+26 75(UR) None 546 (0.7 bu/lb) Sulfur Saybrook, IL bu per lb of nutrient Corn grain produced in the U.S. per unit of fertilizer N used, 1964-2000. 1.4 1.3 1.2 1.1 1.0 0.9 0.8 0.7 0.6 0.5 0.4 1960 1.03 1970 1980 1990 2000 Questions about requirements: Which practices are critical and at what level? • Determination of site-specific attainable yield estimates (Crop models) • Carbon cycling – crop and environmental impacts • Crop rotation vs monoculture • Tillage requirements … no till/strip till • Minimum N requirements, NH4+ vs NO3-, timing • Role of subsoil fertility, organic matter, etc. • Role of manure application • Minimum soil test P and K requirements • Role of secondary and micronutrients • Importance of starter fertilizer (early yield components) Early Plant P status Impacts corn yield potential (outdoor hydroponics study) • P concentrations below 0.5% prior to V3V4 (ISU System), reduced kernels initiated per ear and grain yield • If kernel abortion is limited, final kernel number should be correlated with kernels initiated • High early plant P concentrations should be important for conserving yield potential in high yielding environments Barry & Miller, 1989 Seed is dominant P source V2 - Soil becomes dominant P source Plant demand on the soil for P approaches a maximum P uptake per unit of root length (Barber, Purdue). Plant P concentrations in Herman Warsaw’s corn (Field 3W) Year Growth stage – plant part 1981 1982 1983 1984 1985 P,% Seedling - whole plant 0.57 0.64 0.53 0.57 0.54 Early growth - 3rd leaf from top 0.39 0.35 0.31 0.39 0.39 Tasseling – earleaf 0.33 0.37 0.43 0.28 0.38 Sampled by Shields Soil Service, Saybrook, IL; Analysis by Agrico Labs. • Theory (Barry and Miller; Barber) and practice (Warsaw) suggest starter P might be important to obtain sufficient early plant P concentrations. • Has not been demonstrated as essential for reaching attainable yields under actual field conditions. Soil Test P and K requirements for very high yields: Classical theory • For soil immobile nutrients like P or K, the STL vs % yield relationship should not vary with site yield potential unless plant population increases enough for adjacent roots to compete for each other for P and K (Bray, 1954; Bray, 1963). • Roots normally occupy less than 1% of soil volume (Barber, 1984) … an increase in size of the root system translates into a greater volume of soil P or K being available for uptake. • As long as the size of the root system increases proportionally with yield, a higher yielding crop should not need a higher P or K concentration at the root surface … should not require a higher soil test level. Soil Test P and K requirements for very high yields: Conditions that could lead to higher requirements • Shoot growth increases that exceed root growth increases as yields climb • increasing N, P or available water (Barber, 1984) • decreasing light intensity (Troughton, 1980; Horvath et al., 1980) • soil temperatures in the 75-85 F range (Walker, 1969; Nye and Tinker, 1977) • Redistribution of roots from the surface soil to a low P or K subsoil • soil factors (organic matter, pH, structure, etc.) • varietal factors – vertical vs lateral rooting tendencies • Each % increase in yield has greater economic value … want to be further up the response curve Repeated applications of P or K build profile soil test levels • Manure applied for 10 years in this example • The higher the surface levels, the greater the depth of high fertility • A role that manure has played in high yield systems? • If depth is critical, deep placement may be an alternative to extreme surface level (Ongoing Purdue study) Data: Sharpley et al., 1984 Research needed • “Research has given us good components or parts … But greater strides toward high yields will likely come through fitting those parts into combinations that produce positive interactions.” Dr. Robert Wagner, 1979 Yield change due to higher population, % Impact of hybrid on the influence of N rate on yield response to plant population in Colorado 12 8 4 320 0 -4 225 27K vs 38K A 39K vs 46K B C Variety S.R. Olsen, reported by W. M. Stewart, 2000 D 150 lb N/A Soil test P levels in the 6 leading corn states, 2001 Percent under 20 ppm Bray P1 equivalent Indiana 25 Ohio 31 Illinois 16 Iowa 39 Minnesota 60 Nebraska 47 Soil test K levels in the 6 leading corn states, 2001 Percent under 160 ppm K Indiana 71 Illinois 56 Minnesota 51 Ohio 56 Iowa 54 Nebraska 12 Phosphorus and potassium crop removal to nutrient use ratios for the 6 leading corn producing states. P K Ohio Indiana Illinois Iowa Minnesota Nebraska Ohio Indiana Illinois Iowa Minnesota Nebraska PPI, 2002. 1.32 1.53 1.60 2.03 1.72 1.87 1.07 1.24 1.44 1.47 1.25 1.33 1.19 1.02 1.00 0.89 1.04 0.96 1.77 1.33 2.24 1.62 12.39 3.44 Average of 1998-2000. 65 Medium or below, % Nutrient State Removal to use ratio without with manure manure Medium or below in K: OH IN IL 60 55 50 45 40 1970 1975 1980 1985 1990 1995 2000 Are we managing for attainable yields? • Probably not since typical yields are below what is likely attainable • To narrow the gap we need expanded research at high yield levels • Define site-specific attainable yields • Management practices essential to attain them • A mix of small plot multi-factor research and on-farm field scale studies … linked with appropriate models • Modern technologies should facilitate narrowing the gap between attainable and typical yields • “Calibrated” simulation models to help define attainable yields • Improved weather data and management tools • Site-specific technologies for greater efficiency • Biotechnology for yield protection … and building Are We Managing for Higher Yields? Should We Strive for Higher Yields Symposium American Society of Agronomy Annual Meeting November 11, 2002 Indianapolis, IN Paul Fixen Potash & Phosphate Institute pfixen@ppi-far.org Web: www.ppi-ppic.org


