Review 5.1, 5.2
advertisement

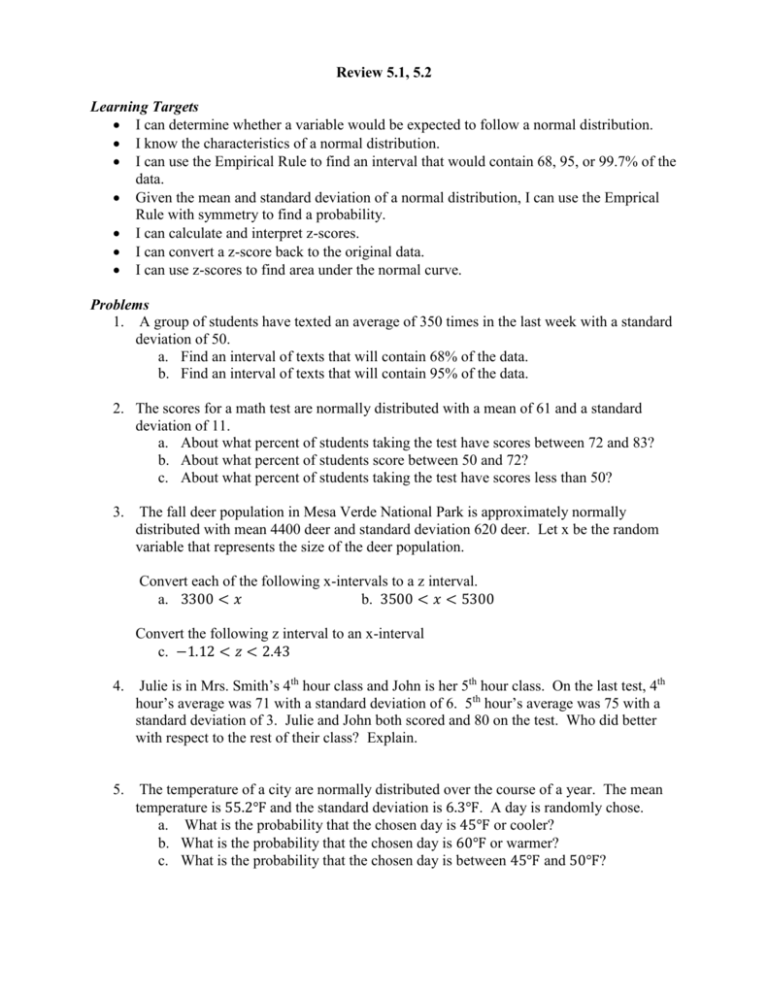
Review 5.1, 5.2 Learning Targets I can determine whether a variable would be expected to follow a normal distribution. I know the characteristics of a normal distribution. I can use the Empirical Rule to find an interval that would contain 68, 95, or 99.7% of the data. Given the mean and standard deviation of a normal distribution, I can use the Emprical Rule with symmetry to find a probability. I can calculate and interpret z-scores. I can convert a z-score back to the original data. I can use z-scores to find area under the normal curve. Problems 1. A group of students have texted an average of 350 times in the last week with a standard deviation of 50. a. Find an interval of texts that will contain 68% of the data. b. Find an interval of texts that will contain 95% of the data. 2. The scores for a math test are normally distributed with a mean of 61 and a standard deviation of 11. a. About what percent of students taking the test have scores between 72 and 83? b. About what percent of students score between 50 and 72? c. About what percent of students taking the test have scores less than 50? 3. The fall deer population in Mesa Verde National Park is approximately normally distributed with mean 4400 deer and standard deviation 620 deer. Let x be the random variable that represents the size of the deer population. Convert each of the following x-intervals to a z interval. a. 3300 < 𝑥 b. 3500 < 𝑥 < 5300 Convert the following z interval to an x-interval c. −1.12 < 𝑧 < 2.43 4. Julie is in Mrs. Smith’s 4th hour class and John is her 5th hour class. On the last test, 4th hour’s average was 71 with a standard deviation of 6. 5th hour’s average was 75 with a standard deviation of 3. Julie and John both scored and 80 on the test. Who did better with respect to the rest of their class? Explain. 5. The temperature of a city are normally distributed over the course of a year. The mean temperature is 55.2℉ and the standard deviation is 6.3℉. A day is randomly chose. a. What is the probability that the chosen day is 45℉ or cooler? b. What is the probability that the chosen day is 60℉ or warmer? c. What is the probability that the chosen day is between 45℉ and 50℉? Answers: 1a) 300-400 b) 250-450 2a) 13.5% b) 68% 3a) −1.77 < 𝑧 b) −1.45 < 𝑧 < 1.45 c) 16% c) 3705.6 < 𝑥 < 5906.6 4) John did better with respect to his class. His z-score was higher, so he was more standard deviations above the mean. 5a) .0526 b) .2236 c) .1507


