Global Warming and Hurricanes
advertisement
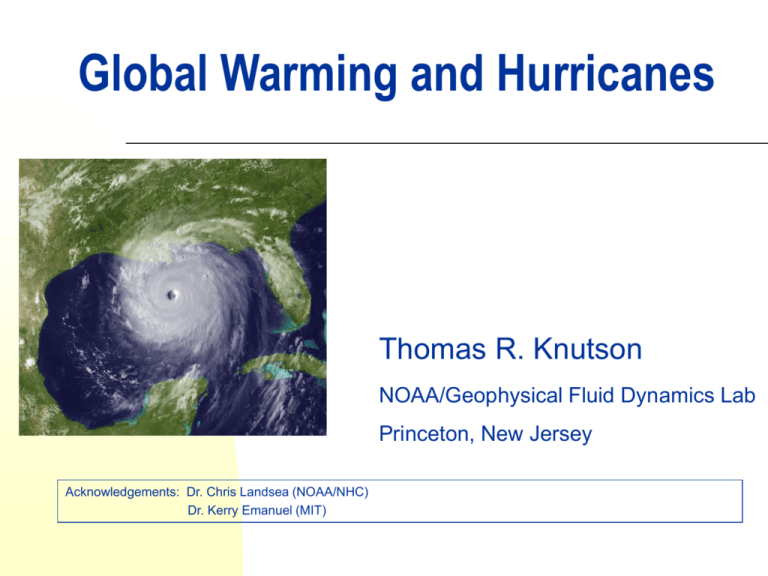
Global Warming and Hurricanes Thomas R. Knutson NOAA/Geophysical Fluid Dynamics Lab Princeton, New Jersey Acknowledgements: Dr. Chris Landsea (NOAA/NHC) Dr. Kerry Emanuel (MIT) Global Warming and Hurricanes: Historical Perspective and Future Outlook Global warming and its potential impact on the built environment (overview) Historical observations: sea surface temperatures and hurricanes Future simulations of tropical sea surface temperatures and hurricane intensity Future research directions Global Warming and Hurricanes: Historical Perspective and Future Outlook Global warming and its potential impact on the built environment (overview) Historical observations: sea surface temperatures and hurricanes Future simulations of tropical sea surface temperatures and hurricane intensity Future research directions Surface Temperature Anomalies during most recent Inactive and Active Atlantic Major Hurricane Eras Inactive Era (July 1966 - Dec.1989) Active Era (Jan. 1995 – Aug. 2005) Data Source: HadCRUT2v (Climatic Research Unit, U.K.) a) CM2.1 All Forcings Global Mean Surface Temperature Simulations: 1870-2000 b) CM2.1 Natural Forcings Krakatau eruption c) CM2.1 Anthropogenic Forcings Paleoclimate evidence… Source: Petit et al., Nature, 1999. CO2 and temperature are highly correlated on glacial/interglacial time scales… Estimates of radiative forcing during last ice age: ~ -6.5 W/m2 (Hansen 1993) are comparable in magnitude to future positive forcing over the next 100-150 years under some IPCC scenarios… Potential Impacts of Climate Change on the Built Environment Heat and thermal stress Floods and drought Flood risk; agricultural impacts; wildfire risk Sea level rise Infrastructure sensitive to thermal stress; heat mortality; wildfire risk Exacerbate coastal flooding, including from storm surge Tropical cyclones Increased wind damage, flooding from rains, and storm surge # of models that predict increase in precipitation by 2100 in A1B scenario, out of 20 models used by IPCC/AR4 Red = wetter Blue = drier Source: Isaac Held, GFDL/NOAA Potential increasing risk of great floods under future climate change… Modeled return period of 100-yr flood under 4xCO2 climate change Source: Milly et al. 2002, Nature, v. 415, p. 514-517. Based on one model (GFDL R30). Global Warming and Hurricanes: Historical Perspective and Future Outlook Global warming and its potential impact on the built environment (overview) Historical observations: sea surface temperatures and hurricanes Future simulations of tropical sea surface temperatures and hurricane intensity Future research directions Trends in Tropical Atlantic “Main Development Region” SSTs… Main Development Region Source: Chris Landsea (NOAA/National Hurricane Center) All Forcings (n=8) Why have Tropical Atlantic (MDR) SSTs warmed? GFDL CM2 coupled model historical simulations (18602000); Aug-Oct season Natural Forcings Only (n=4) 5-yr running means Anthropogenic Forcings Only (n=4) Minimum surface pressure (mb) NW Pacific Basin: Intensity vs. SST The most intense storms occur at high SSTs Sea surface temperature (deg C) Source: Baik and Paek, J. Meteor. Soc. Japan (1998). Used with permission. 2005 N=28 Source: Chris Landsea, NOAA/National Hurricane Center. TK Added 2005 bar (unofficial). Note that 1933 had 21 named storms. 2005 N=7 Source: Chris Landsea, NOAA/National Hurricane Center. TK Added 2005 bar (unofficial). Original PDI from Emanuel (2005) Revised PDI from Landsea (2005 - updated) Emanuel (2005) Emanuel’s Multi-basin Tropical Cyclone Power Dissipation Index (PDI) has increased substantially over past 50 years, along with tropical SSTs Source: Kerry Emanuel, MIT, http://wind.mit.edu/~emanuel/anthro2.htm. SST anomaly (deg C) with arbitrary vertical offset. PDI scaled by constant. Storm-Maximum Power Dissipation Index – Atlantic Basin Source: K. Emanuel, MIT, 2006 Atlantic Basin: SSTs vs number of tropical cyclones Source: Kerry Emanuel, MIT Webster et al.: The percentage of hurricanes which reach Category 4-5 has increased in all basins, comparing two recent 15-year periods… 45 40 35 30 1975-1989 1990-2004 25 20 15 10 5 0 North Atlantic East Pacifc West Pacific Southwest Pacific North Indian South Indian Question: Are the historical data adequate for this conclusion? Source: Adapted from Webster et al., Science, Sept. 2005. Knaff and Sampson’s reanalysis of 1966-87 NW Pacific max intensities produces a reduced Cat 4-5 trend, relative to “best track” Figure 4. The annual counts and sociated as trends with category 4&5 TCs occurring in the western North Pacific Basin for the years 1966-2004 are shown. Notice the change in the trends as a result of the reanalysis. Again, blue and red bars and lines are associated with the best k and trac the reanalysis using e th MSLP data, respectively. Source: Knaff and Sampson, AMS Hurricanes Conference Proceedings, 2006 Sriver and Huber’s PDI from reanalysis, although weaker, is well-correlated after 1978 with Emanuel’s PDI from “best track” data (Atlantic + NW Pacific) Figure 1 5 ERA Global PD ERA Global PDI ERA at+wp PDI Emanuel at+wp PDI 4 3 Standard Deviations 2 1 0 -1 -2 -3 1960 1970 1980 1990 Source: Sriver and Huber, Geophysical Research Letters, in press. 2000 Source: Chris Landsea, NOAA/NHC Source: Chris Landsea (NOAA/National Hurricane Center) Georgia-New England Major Hurricanes 1851-2004 Source: Chris Landsea (NOAA/National Hurricane Center) Source: Chris Landsea, NOAA/NHC Conditions Associated With the Active 2004 Atlantic Hurricane Season Source: Chris Landsea (NOAA/National Hurricane Center) A tale of three seasons… 1995…very active… but few strong U.S. landfalls 2004…active… four Florida hurricanes Category 2005… very active… four major U.S. Gulf Coast hurricanes A tale of three seasons… 1995…very active… but few strong U.S. landfalls 2004…active… four Florida hurricanes 2005… very active… four major U.S. Gulf Coast hurricanes Plots: September 500mb geopotential heights Global Warming and Hurricanes: Historical Perspective and Future Outlook Global warming and its potential impact on the built environment (overview) Historical observations: sea surface temperatures and hurricanes Future simulations of tropical sea surface temperatures and hurricane intensity Future research directions Hurricane–region SSTs in the 21st Century GFDL Simulations: Hurricanes are more intense for warmer climate conditions …(~4% per deg C) Note: Min. central pressures are averages over day 5 of integrations. Source: Knutson and Tuleya, J. Climate, 2004. GFDL Simulations: Hurricanes have significantly more near-storm rainfall for warmer climate conditions …(~12% per deg C) Average rainfall in a 32,700 km2 region of highest 6-hour accumulation (equivalent to 100km radius region). So What’s the Problem? Reality check: comparing models with observations… GFDL Model wind speed intensity, V (and hurricane theory) vs SST: ~4-5% per oC Emanuel (2005) for Atl, NW Pac, NE Pac: V3 increases 50% for 0.5oC, so V: ~30% per oC Emanuel (2006) for Atlantic only: Century-scale data: V increases ~10% per oC; Data since 1980 only: ~20% per oC Factor of 2 to 6 discrepancy in sensitivity… Implications for future projections?? Resolving the Discrepancy? Possibilities: 1. Past trend of intensity over-estimated? (i.e.: the data is wrong) 2. Hurricane model/theory not sensitive enough to SST change? (i.e., the models are wrong) 3. Other factors besides SST which can affect potential intensity are playing a role? (i.e., our simple analysis is wrong) Global Warming and Hurricanes: Historical Perspective and Future Outlook Global warming and its potential impact on the built environment (overview) Historical observations: sea surface temperatures and hurricanes Future simulations of tropical sea surface temperatures and hurricane intensity Future research directions Where are we going from here? Simulations of Atlantic hurricane frequency using nested regional models… GFDL Zetac Nonhydrostatic Regional Model: 18km Tropical N. Atlantic Simulation Simulated hurricanes Observed vs Simulated Atlantic Tropical Storm Tracks 1982: Inactive year Observed (Aug-Oct) Simulation 2 (48-hr nudging) 1995: Active year Observed (Aug-Oct) Simulation 2 (48-hr nudging) Category GFDL Zetac regional model, 18km resolution, large-scale nudged toward observed large scale Note: Uses large-scale interior nudging Note: Winds derived from pressure. Tropical Storm Formation Tropical Storm Occurrence Hurricane Occurrence Observed Observed Observed Simulated Simulated Simulated Period of Simulation: August-October seasons, 1980-2005 Model: GFDL Zetac Regional Model with large-scale interior nudging to NCEP Reanalysis Summary of Main Points: Global Warming and Hurricanes Tropical SSTs (including tropical North Atlantic): Substantial warming (~0.6oC) occurred in 20th century, roughly tracking global mean temperature Substantially greater 21st century warming (~2oC) is anticipated due to anthropogenic forcing (greenhouse gas emissions, etc.) Historical hurricane observations give conflicting information on past trends: Several Atlantic hurricane activity measures are dominated by multi-decadal “cycles” or noise (e.g., landfalling PDI)—not trends. Some basin-wide indices show unprecedented levels in recent years, correlated with rising SSTs. Data quality issues remain unresolved at this time. Hurricane intensity sensitivity implied by some studies greatly exceeds that of current model simulation and theory, a discrepancy that remains unresolved at this time. GFDL hurricane model future simulations: Maximum intensities increase (roughly ½ category or 7% -- per 100 yr) Near-hurricane precipitation increases (roughly 20% per 100yr) Ongoing work at GFDL: high-resolution seasonal Atlantic simulations Future frequency changes? highly uncertain Futurte regionally specific effects? highly uncertain

