You can*t fatten a calf by weighing it* - proverb
advertisement
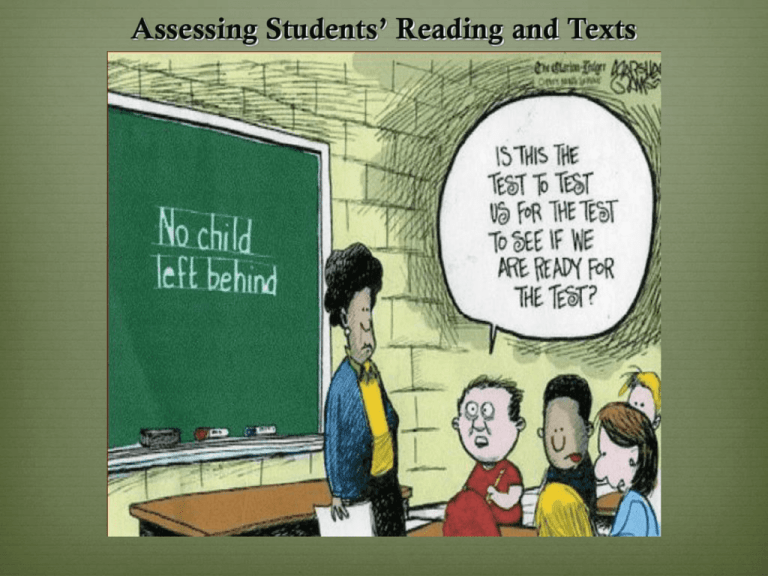
Assessing Students’ Reading and Texts Agenda Assessment Humor Major Issues With Accountability and Reading Assessment America’s Infatuation with Assessment and Accountability What Statistics Tell Us: A little and a lot Reading Assessments for Your Class Assessment Two types of assessment: Formal and Informal Assessment is ever-present reality Good teachers are always assessing their students Good teachers are always assessing their own practice Sign of a bad teacher is one who is not introspective and seeking constructive feedback! EXAMPLES Accountability = Assessment ??? High-Stakes Testing “You can’t fatten a calf by weighing it” - proverb (and a quote from House the floor during the NCLB debate) Origins of High-Stakes Testing Schooling and high stakes testing grew exponentially in conjunction with industrialization and with “modern” psychology (a la E.L. Thorndike) Worldwide “paradigm shift” (Kuhn, 1962) from rural farming to industrialization Origins of High-Stakes Testing Schools as Factories: Assembly lines (age-graded classrooms) Interchangeable parts (teachers all teach same curriculum in each grade) Product (all students have same knowledge when finished) Quality control (tests at specific intervals to ensure learning) Belief that similar inputs = similar outcomes = measurable knowledge Standardized Tests: Why Americans Love ‘em Belief that standardized tests are inherently fair Standardized tests lend themselves to statistical analysis and reporting U.S. population tends to trust statistics Belief that STATISTICS = UNBIASED Belief that statistics are math U.S. Statistics: Test your knowledge At what pace has the murder rate grown over the last 40 years (in other words, how much worse is murder per capita now than 40 years ago)? How has the violent crime rate changed in the last 30 years? How much more likely are children to be abducted today compared to 25 years ago? 40 years ago? Statistics Answer to ALL of the ABOVE: Far less Violent crimes have fallen relatively consistently since 1972. U.S. Statistics: Test your knowledge At what pace has the murder rate grown over the last 40 years (in other words, how much worse is murder per capita now than 40 years ago)? How has the violent crime rate changed in the last 30 years? How much more likely are children to be abducted today compared to 25 years ago? 40 years ago? If you were answering these questions as a lay person— and not in the context of this class—how would you answer? How would most people you know answer? What leads people to answer as they do? Misuse of Statistics Take the following example: "Every year since 1950, the number of American children gunned down has doubled.” (Children’s Defense Fund) Misuse of Statistics Take the following example: "Every year since 1950, the number of American children gunned down has doubled.” (Children’s Defense Fund) Now the real statistic: "The number of American children killed each year by guns has doubled since 1950.” (Children’s Defense Fund) Misuse of Statistics Take the following example: "Every year since 1950, the number of American children gunned down has doubled.” (Children’s Defense Fund) Now the real statistic: "The number of American children killed each year by guns has doubled since 1950.” (Children’s Defense Fund) By the first account, 1995’s murder rate for children (when the first quote above appeared) would have been 35 trillion children Statistics When people who are ‘trusted’ quote statistics, what they say is given even more credibility (often regardless of how ridiculous the claim). Using your incredible statistical (and basic math) skills, what is wrong with the following statistical analysis? Bad Statistics! Bad Dog! Statistics 1) PER CAPITA is a ratio. It does NOT change when the population size changes. Per capita is Latin for by the head or for each head - Example: If I were to say that 20% of Russians smoke, it does not matter if the population of Russia is 10 people, 200,000 people, or 400,000 people. - One in five Russians smoke. 2) Statistical procedures and measurements are prone to specific kinds of bias, but “the way they do statistics” does not change Statistics = Fact? Statistics can be manipulated and are seldom free of bias Discarding Unfavorable Data Sampling bias/Margin of Error Leading/Loaded Question bias False causality Null Hypothesis Numerous other issues (see examples in hyperlinks below) For more examples of common misuses of statistics, see: http://en.wikipedia.org/wiki/Misuse_of_statistics http://cseweb.ucsd.edu/~ricko/CSE3/Lie_with_Statistics.pdf http://knowledge.wharton.upenn.edu/article/the-use-and-misuse-of-statistics-how-and-whynumbers-are-so-easily-manipulated/ Statistics = Fact? Discarding Unfavorable Data Companies and their research staff can—and often do— ignore data that contradicts what they hope to find and/or they fail to publish studies that are disadvantageous to them. Medical studies in which the outcomes do not favor the introduction and use of a new (and costly) medicine. Ignoring myriad unfavorable variables and outcomes while selectively using those that are favorable (e.g., the drug reduces arthritis pain but increases risk of death fourfold). Antidepressant company researching the benefits of a new drug choose to discard from the study sample a group of people who showed dramatically increased risk of suicide when on the drug (excluding them for myriad reasons). Statistics = Fact? Sampling Bias (also correlates with Margin or Error) Recent Example: The 2012 Romney Campaign managers and statisticians genuinely thought the race would be close or that they would win handily. They based this upon statistics garnered through sampling voters by telephone poll. They ignored the findings of statistician Nate Silver who had in 2008 accurately predicted the electoral vote who was again predicting (accurately) the 2012 electoral vote. “Dick Morris, former Campaign manager for Bill Clinton's 1996 reelection [and a leading strategist for Mitt Romney] has absolutely put his political pundit reputation on the line by declaring that Mitt Romney will win the Presidency in a landslide, which of course mirrors yours truely's prediction of Romney getting 52% of the votes against Obama's 47%.” - JustPlainPolitics.com Romney Sampling = “likely voters’ with home phones willing to answer a poll about their preference of Presidential candidates. Statistics = Fact? Leading/Loaded Question Bias Do you support the attempt by the USA to bring freedom and democracy to other places in the world? Do you support the unprovoked military action by the USA? Do you support ObamaCare? Do you support the Affordable Care Act? Do you think teachers should be held to high standards that are measured fairly and accurately? Do you support more standardized testing in K-12 public school classrooms? Statistics = Fact? False causality (A ‘causes’ B) Correlation is NOT causation. Many things are correlated (related) to each other, but this does not mean that one thing causes another. Almost all heavy drug use starts with first with alcohol or marijuana use. Thus, marijuana use causes heroin addiction (FALSE). The number of people buying ice cream at the beach is statistically related to the number of people who drown at the beach. Thus ice cream causes drowning (FALSE). Statistics = Fact? Misuse of Null Hypothesis Statisticians use the ‘null hypothesis’ as their starting point— that there is no relationship between two measured phenomena or that a potential medical treatment has no effect—and assume this true until proven otherwise via conclusive evidence (confidence intervals). The U.S. Court system follows a similar approach: Innocent until proven guilty beyond a reasonable doubt. But the acquittal of a defendant does not prove the defendant “innocent” of the crime; rather it merely states that there is insufficient evidence for a conviction. If a tobacco company runs studies to show that its products do not cause cancer. But it uses a small sample and the study is done over a short period of time. Thus it is unlikely that they’ll disprove the null hypothesis (that there is no relationship between using X tobacco product and cancer). They should not therefore report that their product does not cause cancer. Statistics Bias: Reporting Based upon performance, which stock would you be more inclined to buy? Statistics Bias: Reporting Based upon performance, which stock would you be more inclined to buy? The stocks performed at same rate. The only difference is in how their performance is registered. Statistics = Fact? / (& “reading is reading”) U.S. population tends to trust statistics Belief that STATISTICS = UNBIASED (statistics = math) Thus, belief that standardized tests are inherently fair Statistics can be manipulated, poorly done, and biased to find what one is seeking to find Romney Campaign SAT scores as example of school failure (Berliner and Biddle, ) Concern that SAT scores over time not changing or getting higher “Culture of Fear” & Statistics The Bell Curve (Murray & Herrnstein) Statistics and Standardized Tests Standardized tests are trusted to give us an accurate picture of how well students are doing in school. Because they are statistically based, norm-referenced, and relatively easily scored, most people trust the information they give. WHAT DO THEY NOT GIVE? WHAT DO THEY NOT MEASURE? WHAT SOURCES SHOULD WE TRUST FOR READING STATISTICS? A Real (valid) Statistic According to the National Assessment of Educational Progress (NAEP), approximately one in four students in the 12th grade (who have not already dropped out of school) are still reading at "below basic" levels, while only one student in twenty reads at "advanced" levels. High-Stakes Testing Your performance will be based, at least in part, upon your students’ test scores; measures such as Student Success Act (2011) and Race to the Top all rely on grading teachers’ performance as indicators of their teaching ability and performance pay. 50% of your yearly assessment— regardless of content area—will be based upon one test score! This is yet another reason to make sure that your students can read their content area texts effectively: Your job will depend upon it! Different Kinds of Testing Norm-referenced tests vs. criterion-referenced tests Norm-Referenced Tests NCLB and large-scale testing tends to be norm-referenced Norm-referenced means a student’s performance is measured against a ‘norm’ for that age, ability, level, etc. Students are compared to a large average Teacher success based largely on norm-referenced test scores Criterion-Referenced Tests Classroom testing is almost always criterion-referenced Criterion-referenced tests measure knowledge or ability on a specific area (whether or not a student has learned specific material) Reliability vs. Validity Reliability refers to the confidence we can place on the measuring instrument to give us the same numeric value when the measurement is repeated on the same object Will students score roughly the same if the test/assessment is repeated (results are not random) Validity refers to whether the assessment instrument/tool actually measures the property it is supposed to measure. Does the assessment tool actually measure the right thing? Reliability vs. Validity Reliability “Another way to think of reliability is to imagine a kitchen scale. If you weigh five pounds of potatoes in the morning, and the scale is reliable, the same scale should register five pounds for the potatoes an hour later (unless, of course, you peeled and cooked them). Likewise, instruments such as classroom tests and national standardized exams should be reliable – it should not make any difference whether a student takes the assessment in the morning or afternoon; one day or the next” (http://fcit.usf.edu/assessment/basic/basicc.html) Reliability CLASSROOM EXAMPLE: “Another measure of reliability is the internal consistency of the items. For example, if you create a quiz to measure students’ ability to solve quadratic equations, you should be able to assume that if a student answers an item correctly, he or she will also be able to answer other, similar items correctly. The following table outlines three common reliability measures.” http://fcit.usf.edu/assessment/basic/basicc.html Validity Validity refers to the accuracy of an assessment -- whether or not it measures what it is supposed to measure. Even if a test is reliable, it may not provide a valid measure. If a test is valid, it is almost always reliable; a reliable test, however, does not correlate with validity. GENERAL RULE: Validity = Reliability Reliability ≠ Validity Validity Validity Imagine a bathroom scale that consistently tells you that you weigh 118 pounds. The reliability (consistency) of this scale is very good, but it is not accurate ≠ Validity Because “teachers, parents, and school districts make decisions about students based on assessments (such as grades, promotions, and graduation), the validity inferred from the assessments is essential -- even more crucial than the reliability.” (http://fcit.usf.edu/assessment/basic/basicc.html) When you try to assess whether or not a student is able to read a text, you must use a valid measurement. For instance, students may be able to read and comprehend all of the words of a text but not understand the content. Testing for their ability to literally ‘read’ the text would not be a valid assessment. The figure above shows four possible situations. In the first one, you are hitting the target consistently, but you are missing the center of the target; you are consistently and systematically measuring the wrong value for all respondents. This measure is reliable, but not valid (that is, it's consistent but wrong). The second shows hits that are randomly spread across the target. You seldom hit the center of the target but, on average, you are getting the right answer for the group (but not very well for individuals); you get a valid group estimate, but you are inconsistent. Here, you can clearly see that reliability is directly related to the variability of your measure. The third scenario shows a case where your hits are spread across the target and you are consistently missing the center. Your measure in this case is neither reliable nor valid. Finally, we see the "Robin Hood" scenario -- you consistently hit the center of the target. Your measure is both reliable and valid. High-Stakes Tests Today’s Corollary: A gun aimed at teachers saying “If all of your students don’t score well on the test, you’re a bad teacher who needs to go.” Bang Assessment & Reading You, the content area teacher, can do a number of relatively simple assessments to gauge a student’s or a group of students’ reading ability/level There are also numerous ways to determine the reading level of various texts (textbooks, articles, web pages, etc.) The goal: to match readers’ ability to appropriate texts (within the Zone of Proximal Development) Assessment & Reading Informal Assessments Questioning: Questioning (orally) students about textual information (from general to specific, making note of students’ responses in some format) Questioning students directly (but privately) about their reading abilities Students know when they struggle with reading & are often more open about their struggles than you would initially imagine. Assessment & Reading Informal Assessments: Observation: when and where do students struggle with reading? Watch for (and make note of) those students who never volunteer to read and who avoid reading out loud, even in small groups Listen to peer’s comments about individual’s reading ability Watch students as they read (do they look up often? are they easily distracted? do they react negatively or disruptively?) Speed of reading is a good indicator of reading text ability (though not always!) Rate of Comprehension There is, obviously, a relationship (correlation) between how quickly one reads and one’s level of fluency. Good readers read more quickly. This is not a one-to-one correspondence.: Rate of Comprehension: Create a simple ratio for how long it takes students to read a passage of a specific length. This measure is best used with a Comprehension Inventory (see p. 111) Note that speed does not necessarily correspond with accuracy (sometimes slower readers can be reading for better understanding than faster readers). By combining the Comprehension Inventory and the Rate of Comprehension one can get a fuller picture (i.e., students who rush through a reading but read superficially and students who spend too much time on one passage). Readability Readability formulas Can be good arbiter of difficulty of text Used in conjunction with other data (using it alone tells you very little that can be of use; you must use such information with other points of data and what you know about your students) Zone of Proximal Development Do NOT use readability formulas to tailor all of your information/texts to students’ respective abilities Doing so can hinder student reading growth Readability formulas do not correlate with students’ individual abilities, background knowledge, or ability to read specific texts What did you find about the texts you selected using the Fry Readability Graph or the Flesch-Kincaid Readability Formula? Reading and ZDP Zone of Proximal Development (Lev Vygotsky) Readability Readability formulas: A caveat Readability formulas can be misused and misunderstood. Basic readability measures are simple formula: ration of syllables to words. But, it does NOT take into account: Specialized vocabulary (regardless of length of word) Difficulty in construction of passages (think in terms of “Truth is untruth insofar as…” and poetry Assessment & Reading There are a number of formal assessment tools for determining a student’s ability to read well: Dynamic Indicators of Basic Early Literacy Skills (DIBELS) – primarily for emergent literacy and early literacy) Woodcock Reading Mastery Test – Ibid Diagnostic Assessment of Reading (DAR): can be used for secondary students (expensive) District Measures (FCAT and other measures) Lexile Scores Readability Lexile© Scores Lexile scores can be obtained through state agencies (Departments of Education). The Scholastic Reading Inventory (SRI) provides a Lexile score. Check with your school or district to find out if a student or students have been tested in ways that measure Lexile. Some resources are free (analyzing a classroom text for example) Readability Lexile Scores Lexile gives a score that roughly corresponds to a range in which the average readers in that age should fall. Lexile also categorizes texts to determine its Lexile score (reading difficulty) Teachers can use this data to find appropriate reading materials for students. Cloze Tests Cloze Tests Help you see how well students know material (can be especially helpful as a pre-test of content) while also helping you determine reading ability Formula for a cloze test: 1) Select 250-500 words for a selected piece of text 2) Leaving first sentence intact, begin deleting every fifth to seventh word of the text thereafter (delete a mixture of important vocabulary, conjunctions, verbs, etc.) as this tells teachers a great deal about comprehension 3) Delete fifty words. 4) Multiply students’ exact word replacements (or very close substitutions) by two to get percentage correct Simple Cloze Tests as a class http://www.edict.com.hk/vlc/cloze/cloze.htm Readability & Comprehension Readability vs. Comprehension Readability rates the text's complexity in terms of words and grammar, but we're actually more interested in the text's difficulty in terms of reader comprehension of the content. Sad to say, no formula can measure whether users understand your site. Take, for example, the following two sentences: He waved his hands. He waived his rights. Both score well in readability formulas: simple words, short sentences. But whereas everybody understands what the first sentence describes, you might need a law degree to fully comprehend the implications of the second sentence. Summary and Discussion: Using This Information What can YOU do? Find out how well your students are reading Prior test data (state measures, other measures, IEPs, etc.) Informal assessments that you conduct in your content area Determine readability AND supplement accordingly You may not have a choice of whether or not to use specific text If you do have a choice, choose wisely (not catering to students’ weaknesses, but within their ‘zone’ of proximal development) Readability Lexile© Scores Lexile scores can be obtained through state agencies (Departments of Education). The Scholastic Reading Inventory (SRI) provides a Lexile score. Check with your school or district to find out if a student or students have been tested in ways that measure Lexile. Some resources are free (analyzing a classroom text for example) Readability Lexile Scores Lexile gives a score that roughly corresponds to a range in which the average readers in that age should fall. Lexile also categorizes texts to determine its Lexile score (reading difficulty) Teachers can use this data to find appropriate reading materials for students. Assessment & Reading Observation As the teacher your knowledge is the best indicator of students’ relative abilities to read When and where do students struggle with reading? Watch for (and make note of) those students who never volunteer to read and who avoid reading out loud, even in small groups Listen to peer’s comments about individual’s reading ability Watch students as they read. Do they look up often? Are they easily distracted? Do they react negatively or disruptively? Speed of reading is a good indicator of reading text ability (though not always!) Assessment & Reading Questioning Questioning (orally) students about textual information (from general to specific, making note of students’ responses in some format) Questioning students directly (but privately) about their reading abilities Students know when they struggle with reading Informal Observation & Questioning Video Assessment of Reading: Individual San Diego Quick (SDQ) Create a list of vocabulary words from your discipline/content area that range in “readability” Monosyllabic to polysyllabic, common English words to Latin- based words, etc. Paste individual words onto note cards. Note readability level of word on back of card (using your judgment and/or readability formulas) Starting with lower-level words, test student’s ability to pronounce the word randomly and quickly (gauge their confidence with the words) Note where students begin to struggle. Move forward AND backward with word difficulty to try to determine where student is comfortably reading them; this will help determine their reading level Assessment of Reading: Individual Cloze Tests Help you see how well students know material (can be especially helpful as a pre-test of content) while also helping you determine reading ability Formula for a cloze test: 1) Select 250-500 words for a selected piece of text 2) Leaving first sentence intact, begin deleting every fifth to seventh word of the text thereafter (delete a mixture of important vocabulary, conjunctions, verbs, etc.) as this tells teachers a great deal about comprehension 3) Delete fifty words. 4) Multiply students’ exact word replacements (or very close substitutions) by two to get percentage correct Simple Cloze Tests as a class More Cloze Tests Assessment & Reading: Group Content Area Reading Inventory (CARI) This is basically an informal test that you develop to see how well students are reading specific material –using your knowledge of the text—to test if students understand the main ideas, vocabulary, etc. It should be based upon literal answers, inferred answers, predictive answers In the text (word-for-word), searching the text (in the text but in different wording), inferential (inferred in the text but not directly stated), applied (in one’s head/experience, thought-provoking) Can be used in a fashion similar to a pre-test (NOT graded) Click here for more on creating and using CARI Assessment & Reading: Group Informal Reading Inventory (IRI) Assign a longer passage for all students to read (one that they have not read before); have they put their names on a note-card with four squares on it Tell them that they will each read the passage aloud Create a note-taking system (for yourself) to note students’ strengths and weaknesses Go around the room, stopping to listen to students as they read Look for fluency, vocabulary struggles, mispronunciations, frequent stopping and starting, speed of reading, etc. Make (simple) notes of each student’s areas of strength and weakness & record this in a reading inventory log Create learning opportunities and specific activities for students based upon reading ability) Click here for more on creating and using IRI Assessment of Reading: Group Student Response Form (SRF) Have students read a passage they have not seen (in your content area/lesson) Give them a response form Include on form a place to mark Reading Time, Part I and Part II questions When students complete reading they: 1) Mark at what time they completed the reading 2) They then answer Part I questions (literal questions “from the text”) NOT using the text 3) Answer Part II questions that are interpretive, analytical, applied) – they may refer to the text for this part. Click here for more information on Student Response Forms Assessment of Reading: Group TIMED READING There is, obviously, a relationship (correlation) between how quickly one reads and one’s level of fluency. Good readers read more quickly. This is not a one-to-one correspondence.: Rate of Comprehension: Create a simple ratio for how long it takes students to read a passage of a specific length. This measure is best used with a Comprehension Inventory (see above or Vacca and Vacca, p. 111) Note that speed does not necessarily correspond with accuracy (sometimes slower readers can be reading for better understanding than faster readers). By combining the Comprehension Inventory and the Rate of Comprehension one can get a fuller picture (i.e., students who rush through a reading but read superficially and students who spend too much time on one passage). Readability Readability formulas Can be good arbiter of the difficulty of a text; however, these are NOT a measure of a student’s reading ability nor should they be used that way! Use in conjunction with other data (using it alone tells you very little that can be of use; you must use such information with other points of data and what you know about your students) Readability Readability formulas: A caveat Readability formulas can be misused and misunderstood. Basic readability measures are simple formula: ration of syllables to words. But, it does NOT take into account: Specialized vocabulary (regardless of length of word) Difficulty in construction of passages (think in terms of “Truth is untruth insofar as…” Unusual word formations, such as poetry Readability Readability formulas: A caveat Parting My life closed twice before its close; It yet remains to see If Immortality unveil A third event to me. So huge, so hopeless to conceive, As these that twice befell. Parting is all we know of heaven, And all we need of hell. - Emily Dickinson Readability Readability formulas: A caveat Parting My life closed twice before its close; It yet remains to see If Immortality unveil A third event to me. So huge, so hopeless to conceive, As these that twice befell. Parting is all we know of heaven, And all we need of hell. 5.6th grade level according to Flesch Kincaid Reading and ZDP Zone of Proximal Development (Lev Vygotsky) Summary and Discussion: Using This Information What can YOU do? Find out how well your students are reading Prior test data (state measures, other measures, IEPs, etc.) Informal assessments that you conduct in your content area Determine readability AND supplement accordingly You may not have a choice of whether or not to use specific text If you do have a choice, choose wisely (not catering to students’ weaknesses, but within their ‘zone’ of proximal development) Summary and Discussion: Using This Information What can YOU do? Use checklist (gauge texts for appropriateness for different readers (see p. 134) Directly Teach the Text and Model Effective Reading to help struggling readers Use read/think alouds, guided questions, pre-reading strategies Use paired or group activities with mixed ability students
