including a sample FAKE lab report
advertisement

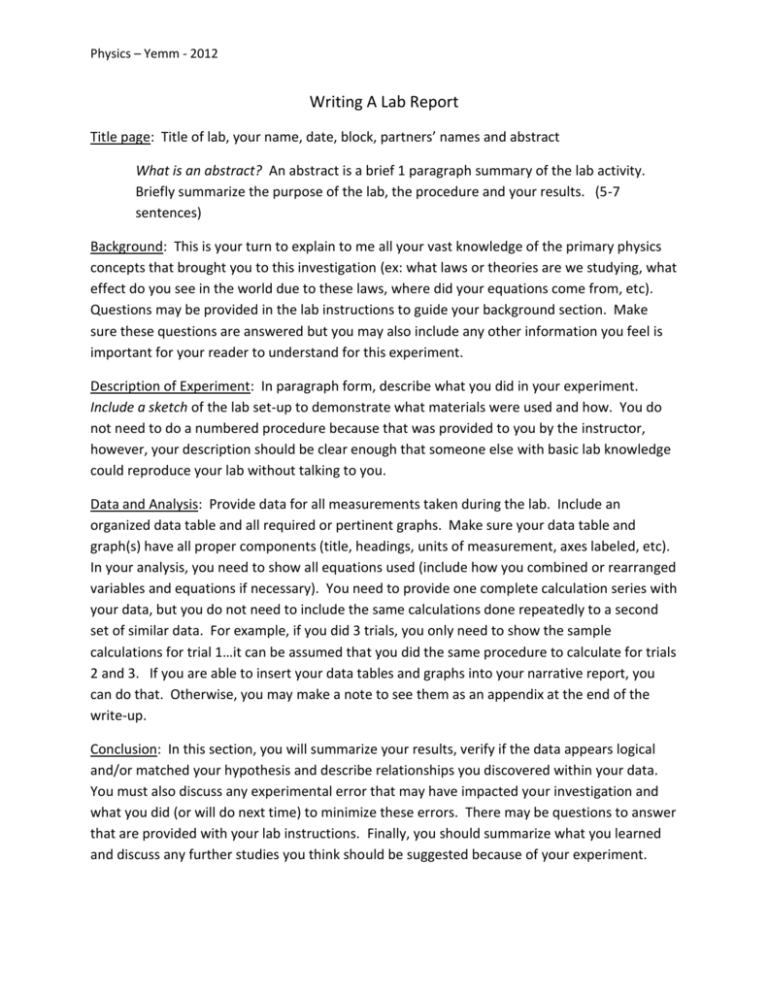
Physics – Yemm - 2012 Writing A Lab Report Title page: Title of lab, your name, date, block, partners’ names and abstract What is an abstract? An abstract is a brief 1 paragraph summary of the lab activity. Briefly summarize the purpose of the lab, the procedure and your results. (5-7 sentences) Background: This is your turn to explain to me all your vast knowledge of the primary physics concepts that brought you to this investigation (ex: what laws or theories are we studying, what effect do you see in the world due to these laws, where did your equations come from, etc). Questions may be provided in the lab instructions to guide your background section. Make sure these questions are answered but you may also include any other information you feel is important for your reader to understand for this experiment. Description of Experiment: In paragraph form, describe what you did in your experiment. Include a sketch of the lab set-up to demonstrate what materials were used and how. You do not need to do a numbered procedure because that was provided to you by the instructor, however, your description should be clear enough that someone else with basic lab knowledge could reproduce your lab without talking to you. Data and Analysis: Provide data for all measurements taken during the lab. Include an organized data table and all required or pertinent graphs. Make sure your data table and graph(s) have all proper components (title, headings, units of measurement, axes labeled, etc). In your analysis, you need to show all equations used (include how you combined or rearranged variables and equations if necessary). You need to provide one complete calculation series with your data, but you do not need to include the same calculations done repeatedly to a second set of similar data. For example, if you did 3 trials, you only need to show the sample calculations for trial 1…it can be assumed that you did the same procedure to calculate for trials 2 and 3. If you are able to insert your data tables and graphs into your narrative report, you can do that. Otherwise, you may make a note to see them as an appendix at the end of the write-up. Conclusion: In this section, you will summarize your results, verify if the data appears logical and/or matched your hypothesis and describe relationships you discovered within your data. You must also discuss any experimental error that may have impacted your investigation and what you did (or will do next time) to minimize these errors. There may be questions to answer that are provided with your lab instructions. Finally, you should summarize what you learned and discuss any further studies you think should be suggested because of your experiment. Physics – Yemm - 2012 SAMPLE LAB REPORT (WARNING: Information in this example in not necessarily accurate…use this as a sample format.) The Effect of Mass on the Acceleration of a Car Rolling Down a Ramp Megan Yemm October 10, 2012 5th block Partners: Minnie Mouse, Bugs Bunny, Sponge Bob Abstract: The purpose of this lab was to investigate the effect of different masses of toon cars on the rate in which the speed of the cars decreased as they rolled down a ramp (acceleration). Cars of similar shape but different masses were rolled down the same ramp while the velocity and time was recorded for each. Data was analyzed to determine the average acceleration for each mass. We found that the mass of the car had no effect on the rate in which it accelerated on the ramp. The mass of the cars increased from 0.4 kg to 1.0 kg, while the acceleration remained virtually unchanged in the range of 2.2-2.4 m/s2. Some error was detected upon the conclusion of the testing so future tests should include cars with similar tires. Physics – Yemm - 2012 Background: Isaac Newton described 5 Laws of Motion that govern all objects in the universe. This investigation focused on the 1st Law of Motion that says that all objects will get faster when they roll down a hill. For this experiment, we will be looking at a velocity vs. time graph to determine the acceleration. You can do this by looking at the y-intercept of the graph and adding it to the final velocity of the car. There are many forces acting on the cars as they roll down the hill including friction, gravity, normal force and applied force. The car rolls down the ramp because all of these forces are balanced causing a net force down the hill. Description of Experiment: A ramp was constructed at a 30° incline using cardboard or Styrofoam propped against several blocks of wood. The Vernier measurement system with Logger Pro software was used to measure speed of a car by setting up 2 photogates along a 5 meter track connected to a computer. Photogates Computer The photogates were set at positions of 15 cm and 150 cm from the top of the ramp. The photogates recorded velocity and time of each trial along the ramp. The cars were released from rest at the top of the ramp (0 cm position) without any push. We ran 3 trials for each of 3 different cars. The cars were similar in shape but varied in their mass. Physics – Yemm - 2012 Data and Analysis: Table 1: The Effect of Mass on the Acceleration of a Car Down a Ramp Mass Trial Time (s) Velocity (m/s) Avg Accel (m/s2) (m/s2) (g) 400 Acceleration T1 1.387 3.89 2.805 T2 T3 750 T1 T2 T3 1000 T1 T2 T3 The acceleration of each trial was calculated using the equation: v/t= a. For example, using data from trial one, 3.89m/s = 2.805 m/s2 1.387 s Then, the average acceleration was calculated for each mass and was compared to establish a relationship. The graph attached at the end of this report demonstration the relationship between the mass of the car and the average acceleration. (See appendix 1.) Conclusion: Before this experiment, we hypothesized that there would be a relationship between mass and acceleration based on Newton’s 1st Law. Our data did not support our hypothesis because no relationship was established. As demonstrated on the graph, as the mass increased from 400g to 1000g, the acceleration varied within a range of 2.2-2.4 m/s2. Upon analysis of our procedure, we noted that the tire and ramp surfaces were not kept Physics – Yemm - 2012 constant with the different masses of cars. This could have an impact on the trials because the coefficient of friction was not kept constant which changes the effect of friction for each different car (mass). Additionally, while we attempted to secure the photogates for all trials, we noted that midway through the trials for the 1000g car, the photogates had rotated slightly and may have altered the velocity measurements. In the future, as the technique is perfected, it would be interesting to investigate the effect of changing surface of the ramp on the acceleration of a car in an attempt to calculate the coefficient of friction. Appendix 1: (see attached) Graph – The Effect of Mass on the Acceleration of a Car Down a Ramp


