AP Statistics Midterm Review Project
advertisement
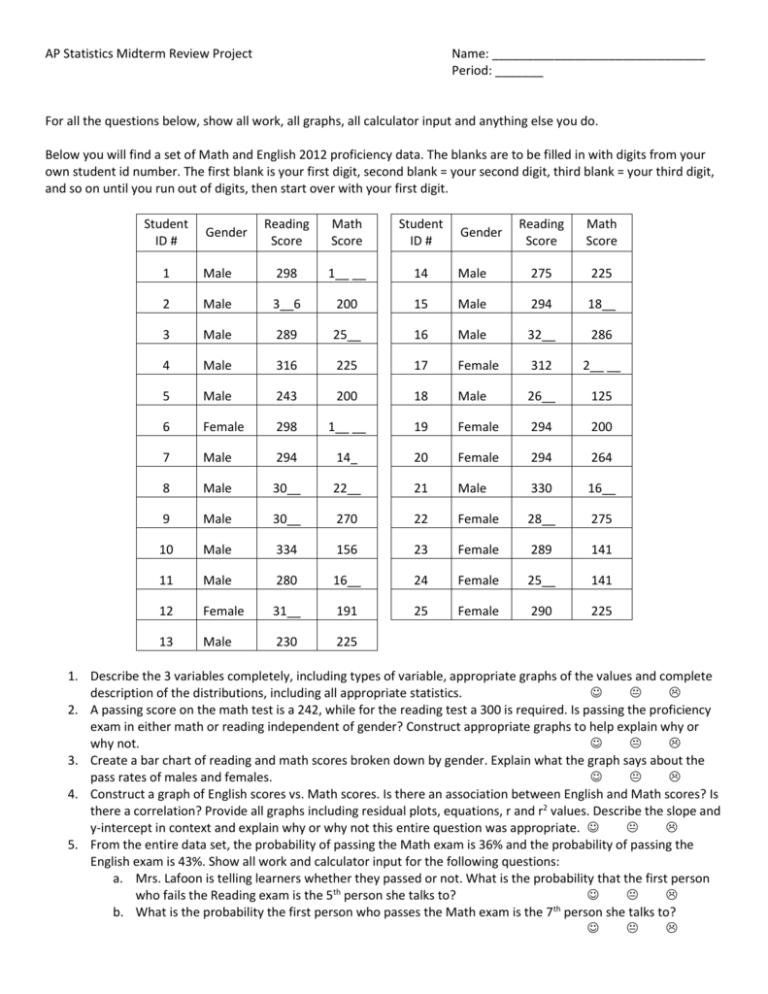
AP Statistics Midterm Review Project Name: _______________________________ Period: _______ For all the questions below, show all work, all graphs, all calculator input and anything else you do. Below you will find a set of Math and English 2012 proficiency data. The blanks are to be filled in with digits from your own student id number. The first blank is your first digit, second blank = your second digit, third blank = your third digit, and so on until you run out of digits, then start over with your first digit. Student ID # Gender Reading Score Math Score Student ID # Gender Reading Score Math Score 1 Male 298 1__ __ 14 Male 275 225 2 Male 3__6 200 15 Male 294 18__ 3 Male 289 25__ 16 Male 32__ 286 4 Male 316 225 17 Female 312 2__ __ 5 Male 243 200 18 Male 26__ 125 6 Female 298 1__ __ 19 Female 294 200 7 Male 294 14_ 20 Female 294 264 8 Male 30__ 22__ 21 Male 330 16__ 9 Male 30__ 270 22 Female 28__ 275 10 Male 334 156 23 Female 289 141 11 Male 280 16__ 24 Female 25__ 141 12 Female 31__ 191 25 Female 290 225 13 Male 230 225 1. Describe the 3 variables completely, including types of variable, appropriate graphs of the values and complete description of the distributions, including all appropriate statistics. 2. A passing score on the math test is a 242, while for the reading test a 300 is required. Is passing the proficiency exam in either math or reading independent of gender? Construct appropriate graphs to help explain why or why not. 3. Create a bar chart of reading and math scores broken down by gender. Explain what the graph says about the pass rates of males and females. 4. Construct a graph of English scores vs. Math scores. Is there an association between English and Math scores? Is there a correlation? Provide all graphs including residual plots, equations, r and r2 values. Describe the slope and y-intercept in context and explain why or why not this entire question was appropriate. 5. From the entire data set, the probability of passing the Math exam is 36% and the probability of passing the English exam is 43%. Show all work and calculator input for the following questions: a. Mrs. Lafoon is telling learners whether they passed or not. What is the probability that the first person who fails the Reading exam is the 5th person she talks to? b. What is the probability the first person who passes the Math exam is the 7th person she talks to? 6. 7. 8. 9. 10. c. In a class of 30 seniors in a math proficiency class, what is the probability that at least 13 learners passed the exam? d. In the same proficiency class, what is the probability that no more than 19 learners passed the exam? The school was given a huge multiyear grant and we have effectively unlimited funds to help remediate and teach the proficiency math. One of the requirements for the grant is to have an experiment to decide the best method of remediation. Design a scientifically valid experiment to determine if Packet A or Packet B, and / or class sizes of 15 20, or 25 is the best method of remediation. a. Be sure to identify levels, factors and treatments. b. A diagram and short paragraph explanation is required. It is determined that the design created in 5 will be too costly, so the administration decides to survey the school to determine how the learners want the remediation. Design a survey using the following methods: a. Simple Random Sample b. Systematic c. Cluster d. Stratified e. Convenience f. Voluntary response Pick one of the survey methods above for each of the biases below, and explain how you reduced the type of bias. Explain fully how you reduced the bias. a. Undercoverage b. Response c. Nonresponse Finally, the administration was convinced by Mr. Waddell that a survey would not be the best way and they asked you to run some simulations to see how effective the methods will be. If a class has 15 learners in it, and the method has a 45% chance of being effective, run 5 trials to see what the outcomes would be. Explain FULLY how you completed the simulations, including what line number you started with on the random number table at the back of the book. After analyzing 3 years’ worth of data, we have calculated the average math score to be 229 with a standard deviation of 21 or N(229, 21). Use this information to answer the following questions. a. If John Doe scored a 187, how many standard deviations below the mean was he? b. If Jane Doe scored a 282, what was her z-score? c. What percent of learners score above a 290? d. What percent of learners score below a 260? e. What percent of learners score between 180 and 276? f. What score would be in the top 15% of all test takers?


