File - Economics - Knoche
advertisement
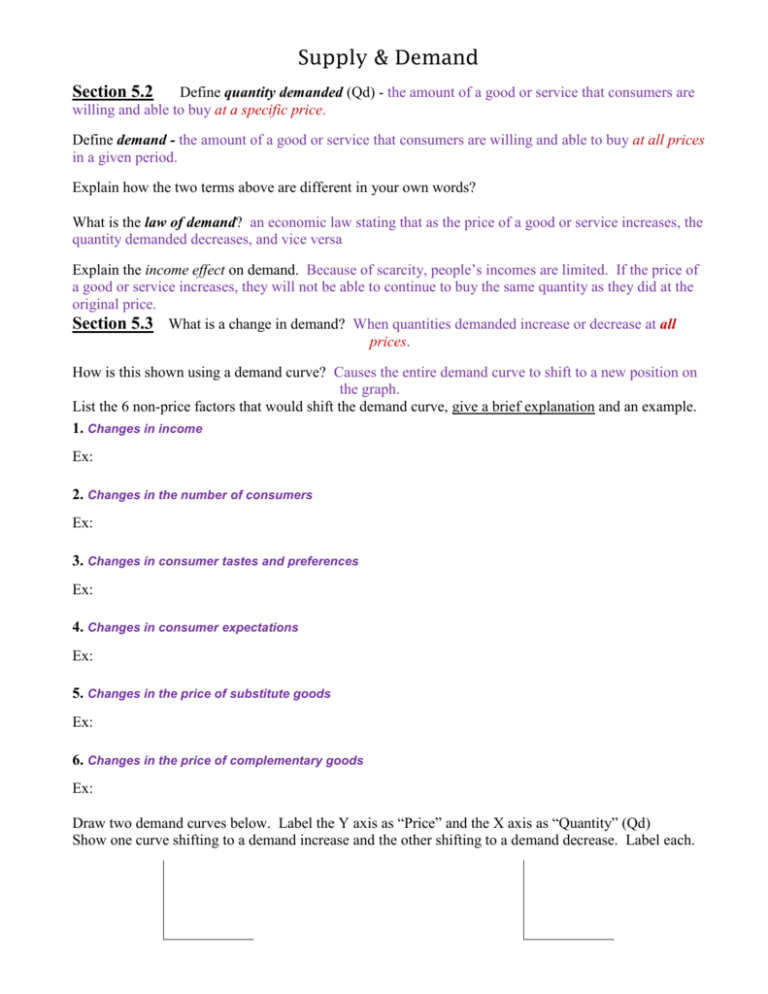
Supply & Demand Section 5.2 Define quantity demanded (Qd) - the amount of a good or service that consumers are willing and able to buy at a specific price. Define demand - the amount of a good or service that consumers are willing and able to buy at all prices in a given period. Explain how the two terms above are different in your own words? What is the law of demand? an economic law stating that as the price of a good or service increases, the quantity demanded decreases, and vice versa Explain the income effect on demand. Because of scarcity, people’s incomes are limited. If the price of a good or service increases, they will not be able to continue to buy the same quantity as they did at the original price. Section 5.3 What is a change in demand? When quantities demanded increase or decrease at all prices. How is this shown using a demand curve? Causes the entire demand curve to shift to a new position on the graph. List the 6 non-price factors that would shift the demand curve, give a brief explanation and an example. 1. Changes in income Ex: 2. Changes in the number of consumers Ex: 3. Changes in consumer tastes and preferences Ex: 4. Changes in consumer expectations Ex: 5. Changes in the price of substitute goods Ex: 6. Changes in the price of complementary goods Ex: Draw two demand curves below. Label the Y axis as “Price” and the X axis as “Quantity” (Qd) Show one curve shifting to a demand increase and the other shifting to a demand decrease. Label each. Section 5.4 Define quantity supplied (Qs) - the amount of a good or service that producers are willing and able to offer for sale at a specific price. Define supply - the amount of a good or service that producers are willing and able to offer for sale at all prices in a given period Explain how the two terms above are different in your own words? What is the law of supply? an economic law stating that as the price of a good or service increases, the quantity supplied increases, and vice versa List and explain the two reasons economists believe that price and quantity supplied (Qs) move in the same direction. 1. production decisions by existing producers – businesses produce more when price goes up to increase their profits 2. market entries and exits - When the price of a good or service increases, new firms may enter a market because they see the potential for profit Section 5.5 What is a change in supply? When market supply at all prices increases or decreases. List the 6 non-price factors that would shift the supply curve, give a brief explanation and an example. 1. Changes in the cost of inputs Ex: 2. Changes in the number of producers Ex: 3. Changes in technology Ex: 4. Changes in producer expectations Ex: 5. Changes in conditions due to natural disasters or international events Ex: 6. Changes in government policy Ex: Draw two supply curves below. Label the Y axis as “Price” and the X axis as “Quantity” (Qs) Show one curve shifting to a supply increase and the other shifting to a supply decrease. Label each.
