Problem 18.1-18.3 Key
advertisement
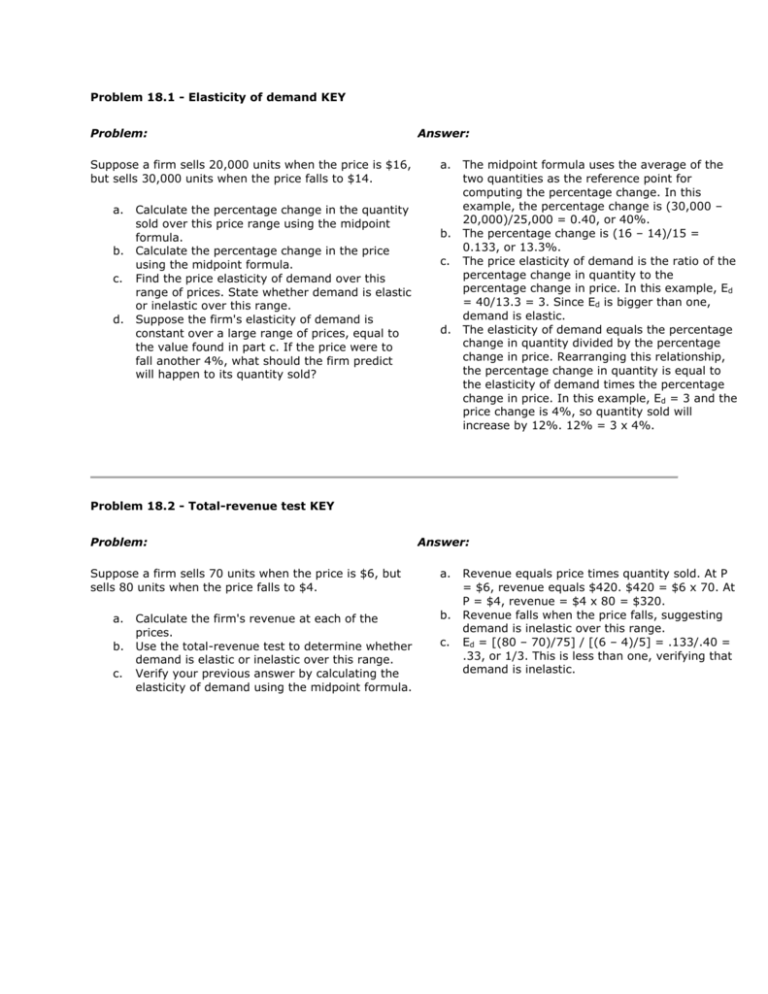
Problem 18.1 - Elasticity of demand KEY Problem: Suppose a firm sells 20,000 units when the price is $16, but sells 30,000 units when the price falls to $14. a. b. c. d. Calculate the percentage change in the quantity sold over this price range using the midpoint formula. Calculate the percentage change in the price using the midpoint formula. Find the price elasticity of demand over this range of prices. State whether demand is elastic or inelastic over this range. Suppose the firm's elasticity of demand is constant over a large range of prices, equal to the value found in part c. If the price were to fall another 4%, what should the firm predict will happen to its quantity sold? Answer: a. b. c. d. The midpoint formula uses the average of the two quantities as the reference point for computing the percentage change. In this example, the percentage change is (30,000 – 20,000)/25,000 = 0.40, or 40%. The percentage change is (16 – 14)/15 = 0.133, or 13.3%. The price elasticity of demand is the ratio of the percentage change in quantity to the percentage change in price. In this example, Ed = 40/13.3 = 3. Since Ed is bigger than one, demand is elastic. The elasticity of demand equals the percentage change in quantity divided by the percentage change in price. Rearranging this relationship, the percentage change in quantity is equal to the elasticity of demand times the percentage change in price. In this example, Ed = 3 and the price change is 4%, so quantity sold will increase by 12%. 12% = 3 x 4%. Problem 18.2 - Total-revenue test KEY Problem: Suppose a firm sells 70 units when the price is $6, but sells 80 units when the price falls to $4. a. b. c. Calculate the firm's revenue at each of the prices. Use the total-revenue test to determine whether demand is elastic or inelastic over this range. Verify your previous answer by calculating the elasticity of demand using the midpoint formula. Answer: a. b. c. Revenue equals price times quantity sold. At P = $6, revenue equals $420. $420 = $6 x 70. At P = $4, revenue = $4 x 80 = $320. Revenue falls when the price falls, suggesting demand is inelastic over this range. Ed = [(80 – 70)/75] / [(6 – 4)/5] = .133/.40 = .33, or 1/3. This is less than one, verifying that demand is inelastic. Problem 18.3 - Consumer and producer surplus Problem: Suppose the market for watermelons can be described by the graph below. Answer: a. b. c. d. e. a. b. c. d. e. If Jon is willing to pay as much as $8 for a watermelon, how much surplus would he receive if he pays the market price for a watermelon? Suppose Figgy Farms requires at least $5 per watermelon to be willing to sell in this market. What is Figgy's producer surplus for one watermelon in this market? How much total consumer surplus is received in this market? How much total producer surplus is received in this market? What is the total surplus (combined consumer and producer surplus) in the market? Consumer surplus is the difference between the maximum Jon is willing to pay and the price he actually pays. The equilibrium price in this market is $6, so his consumer surplus is $2. $2 = $8 – $6. Producer surplus is the difference between the market price and the minimum a seller requires to offer the product for sale. In this case, Figgy's producer surplus is $6 – $5 = $1. Total consumer surplus is the area below the demand curve but above the market price. The area of this triangle on the graph is ½ x ($11 – $6) x 200 = $500. Total producer surplus is the area above the supply curve but below the market price. The area of this triangle on the graph is ½ x ($6 – $4) x 200 = $200. The total surplus is the sum of consumer and producer surplus, or $500 + $200 = $700.


