graphing worksheet
advertisement
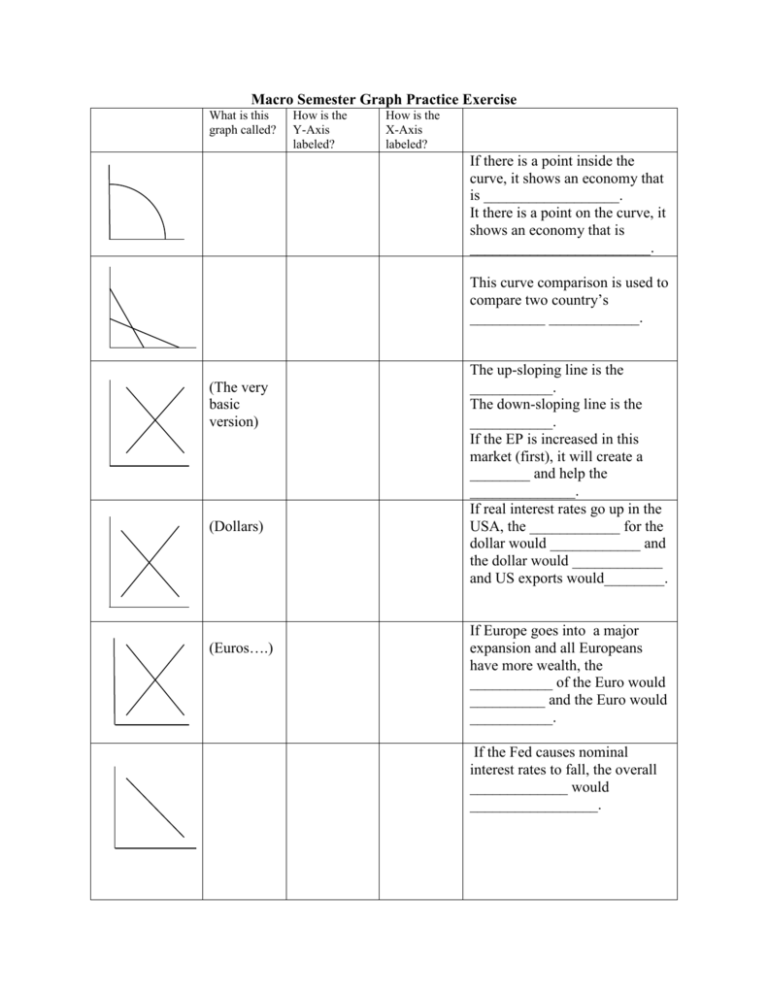
Macro Semester Graph Practice Exercise What is this graph called? How is the Y-Axis labeled? How is the X-Axis labeled? If there is a point inside the curve, it shows an economy that is __________________. It there is a point on the curve, it shows an economy that is ________________________. This curve comparison is used to compare two country’s __________ ____________. (The very basic version) (Dollars) (Euros….) The up-sloping line is the ___________. The down-sloping line is the ___________. If the EP is increased in this market (first), it will create a ________ and help the ______________. If real interest rates go up in the USA, the ____________ for the dollar would ____________ and the dollar would ____________ and US exports would________. If Europe goes into a major expansion and all Europeans have more wealth, the ___________ of the Euro would __________ and the Euro would ___________. If the Fed causes nominal interest rates to fall, the overall _____________ would _________________. (MM) = (MM) = (LF) The vertical line is the ________. This economy is (The end _____________. point of the Which policy would target vertical changing the C and G of the line is the down-sloping line? ________) ___________. Which policy would target changing the Ig of the downsloping line? ________________. If major input costs of energy increased, the up-sloping line will _______________ and EP will ________and EQ will __________. This is known as _____________. The vertical line is controlled by the ___________. When they want to help get out of a recession, they would move the vertical line ____________ by ________ _________. If Congress tries to help a recession end, they would cause the ________ to move _______ and the interest rates would ____________. During a recession, the public will ___________ more and the ___________ line will move ___________. This will cause the domestic economy to be able to _______ more for investment. (LF) (PC) = (Agg.) If Congress runs deficits, the public is buying up bonds. This means that private savings will ____________ and the _________ _______ will rise. The vertical line is the _______. If the down-sloping line has moved to the right, this will probably be due to a time of _______________. (The end point of the vertical To reverse the trend, a society line is the must improve _____________. ________) This series of changes illustrates the concept of ___________ _______. It is caused by a _______________ policy enacted by ______________. Macro Semester Graph Practice Exercise: Key What is this graph called? How is the Y-Axis labeled? How is the XAxis labeled? Production Capital Possibilities Goods Curve Consumer Goods Compar. Advantage (any type) (any type) (The very basic version) Supply and Demand Price Quantity (Dollars) Dollar Market Euros Dollars Q dollars (Euros….) Euro Market Dollars Euros Q euros Investment Demand Interest rates Q Ig dollars If there is a point inside the curve, it shows an economy that is inefficient . It there is a point on the curve, it shows an economy that is efficient . This curve comparison is used to compare two country’s comparative advantage. The up-sloping line is the Supply. The down-sloping line is the Demand. If the EP is increased in this market (first), it will create a Surplus and help the Suppliers . If real interest rates go up in the USA, the demand for the dollar would increase and the dollar would appreciate and US exports would decrease. If Europe goes into a major expansion and all Europeans have more wealth, the supply of the Euro would increase and the Euro would depreciate. If the Fed causes nominal interest rates to fall, the overall gross investment would increase. Aggregate Model Price Level Aggregate Model Price Level (MM) = Money Market (MM) = Money Market (LF) = Loanable Funds (nominal) interest rates (nominal) interest rates (real) interest rates The vertical line is the rGDP LRAS. This economy is (The end in recession. point of the Which policy would target vertical changing the C and G of the line is the down-sloping line? Fiscal FE or Yf) Expansionary. Which policy would target changing the Ig of the downsloping line? Monetary Expansionary. If major input costs of energy rGDP increased, the up-sloping line will decrease and EP will increase and EQ will decrease. This is known as Stagflation. Q money Q money Q loanable funds The vertical line is controlled by the Fed. When they want to help get out of a recession, they would move the vertical line outward by buying bonds. If Congress tries to help a recession end, they would cause the demand to move outward and the interest rates would increase. During a recession, the public will save more and the savings line will move outward. This will cause the domestic economy to be able to borrow more for investment. (LF) = Loanable Funds (real) interest rates Q loanable funds (PC) = Phillips Curve inflation unemploy. (Agg.) Aggregate Model PL If Congress runs deficits, the public is buying up bonds. This means that private savings will decrease and the interest rates will rise. The vertical line is the LRPC. If the down-sloping line has moved to the right, this will probably be due to a time of Stagflation. (The end point of the vertical To reverse the trend, a society line is the must improve productivity. NRU) This series of changes illustrates rGDP the concept of Crowding Out. It is caused by a Fiscal policy enacted by Congress.
