Child Health and Nutrition Project
advertisement
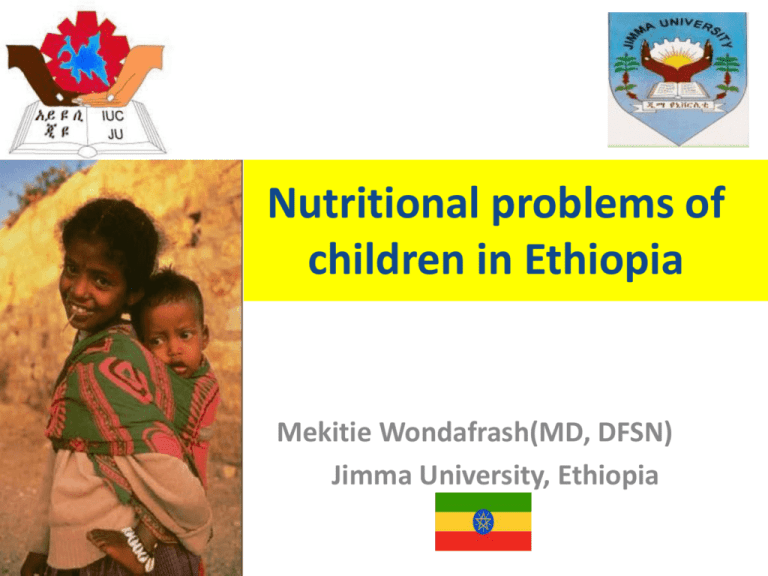
Nutritional problems of children in Ethiopia Mekitie Wondafrash(MD, DFSN) Jimma University, Ethiopia Content 1. Introduction – Background about Ethiopia – Child health in Ethiopia 2. Nutritional problems of children in Ethiopia 3. Child Health and Nutrition project of VLIR-UOS ◦ ◦ Justification /Rationale Expected outcomes of the project ◦ Findings from the baseline survey in Gilgel Gibe Field Research Center 4. Conclusion Introduction • Background about Ethiopia – Geography – Demographic characteristics – Health and Nutritional problems of children in Ethiopia • Health problems • Nutritional problems Mild, moderate and severe Malnutrition Micronutrient malnutrition Source: Ethiopia DHS, 2004 Introduction… Background about Ethiopia Geography: Situated at horn of Africa Position: 3 -150 N latitude , 33 – 480 E longitude Topography: Highest peak at Ras Dashen-4,550 m above sea level Lowest point- Affar Depression at 110m below sea level The total area ¬1.1 million km2 Borders: Djibouti, Eritrea, Sudan, Kenya, and Somalia A large part is high plateaux and mountain ranges Source: CSA, 2000, MOI 2004 Demographic characteristics Population Pyramid of Ethiopia Age group 1994 Population percent 2007 Child health problems in Ethiopia • In general 60 to 80 % of health problems in Ethiopia are due communicable diseases and nutritional problems • Health service coverage is low (about 64%, 2003) • The is poor public health infrastructure contributing to high morbidity and mortality Source: FMOH, 2003 Causes of childhood morbidity and mortality • Neonatal problems – Infection ( congenital, acquired) – Asphyxia • • • • Undernutrition( ranges from mild to severe) Malaria Measles Acute respiratory tract infections ( e.g. pneumonia) • Diarrhoeal diseases Child survival in Ethiopia ( source: Ethiopia DHS 2005) Childhood mortality trends per 1000 Source: Ethiopia DHS, 2000. Timing of mortality in children in Ethiopia ( source: Ethiopia DHS 2000) What are children dying from in Ethiopia ? PROFILES analysis , FMOH 2006 Estimated direct causes of neonatal death for Ethiopia Infection alone contributes to 46% of neonatal death Diarrhoea 3% Other Congenital 7% 4% Asphyixa 25% Tetanus 7% Infection 36% 3/11/2016 Preterm 17% ( Source: Facility based death report, FMOH, 2004) 14 Nutrition in the MDGs MDG Relevance of nutrition Eradicate extreme poverty and hunger Contributes to human capacity and productivity throughout life cycle and across generations Achieve universal primary education Promote gender equity and empower women Reduce child mortality Improves readiness to learn and school achievement Empowers women more than men Combat HIV/AIDS, malaria and other diseases Reduces child mortality (over half attributable to malnutrition) Contributes to maternal health thru many pathways Addresses gender inequalities in food, care and health Slows onset and progression of AIDS Important component of treatment and care Ensure environmental sustainability Highlights importance of local crops for diet diversity and quality Develop a global partnership for development Brings together many sectors around a common problem Improve maternal health Under 5 Mortality Rate Reaching MDG4 is feasible? 160 165 153 140 123 120 109 89 80 HSDP I 95 54 II 40 0 1990 1995 Current Trend 2000 2005 Years 2010 2015 MDG Trend Current U5MR trend versus trend needed to reach MDG for Ethiopia (FMOH, 2006) 3/11/2016 16 Nutritional problems of children in Ethiopia • Ethiopia is one of the most food insecure countries in the world having both chronic and transitory food insecurity and frequent attacks of famine in the recent past – Food insecurity incorporates- low food intake , variable access to food, and vulnerability • Food insecurity is mostly associated with drought, poor land management practices, diseases, attack by pests, destruction of crops by flood, etc.. Current estimated food security conditions: January to March 2009 Source: FEWS NET and WFP Ethiopia Nutritional problems …. • Nutritional problems continue to be the leading cause of morbidity and mortality in children • Manifest by – Protein Energy Malnutrition ( PEM) – Micronutrient malnutrition • Vitamin A deficiency ( VAD ) • Iodine Deficiency disorders (IDDS) • Iron Deficiency Anaemia (IDA) Nutritional problems …. • The plight usually starts during intrauterine life with maternal malnutrition (during and prior to pregnancy) • Continues to childhood with the same condition (Feeding, Health Care, Environment) Trends in malnutrition in under-fives in Ethiopia, 1982-2000 ( Zewuditu et al ,2001) Nutritional Status of Children Under Age 5, 2000 and 2005 Source: Ethiopia DHS, 2005 Nutritional status of children under five years of age Percent Source: Ethiopia DHS, 2005 Stunting, wasting and underweight by age in Ethiopia,2005 Source: Ethiopia DHS, 2005. Global timing of growth faltering in U5 child Stunting at Age 2- critical period UNICEF/C-55-34/Watson (EDHS - 2005) 51% Source: Ethiopia DHS, 2005. Percentage of children under age five whose height-for-age is below 2 SD from mean by region Source: Ethiopia DHS, 2000 Micronutrient deficiencies in Ethiopia • Micronutrient malnutrition is “hard to see” • VAD among children under five years : – Prevalence of Bitot’s spot: 1.7% (1.6% - 1.9%) – Subclinical VAD (<0.7μmol/l): 37.7% (35.6%39.9%) – Corneal ulceration: 0.02% (1.7% - 2.0%) – Corrected child night blindness: 0.7% Source: Tsegaye Demissie et al, 2008 ( Unpublished national survey report ) Micronutrient deficiencies Vitamin A supplementation • Vitamin Supplementation is undertaken routinely in the health institution and during NIDs • However, <50% of U5 children received it the previous 6ms (EDHS,2005) Micronutrient deficiencies Iodine Deficiency Disorders (IDDS): – Only about one in five live in households with adequately iodized salt ( EDHS,2005) – National total goitre rate: 38% Iron Deficiency Anaemia (IDA): • Not documented in Ethiopia , rather over all anaemia is measured through determination of Hgb status • Overall anaemia according to Ethiopia DHS, 2005 – 27% of WRA were anemic – 54% of children between 6-59 mo had anemia Infant and young child feeding practices in Ethiopia • Infant and young child feeding is critical for child growth and development • 96 % of children are ever breastfed • 86 % breastfed within 24 hours of birth • The average length of BF is 26 ms • Only 49% of children under the age of six months are exclusively breastfed • Average length of EBF is only 4 ms • Only 22 % of children 6-23 ms are fed according to IYCF guidelines Infant and Young Child feeding… 100 % 50 Exclusive Breastfeeding Complementary Feeding 49 50 0-6 months 6-9 months UNICEF/93-COU-0173/Lemoyne 75 25 0 Source: Ethiopia DHS2005 Breastfeeding practice by age in Ethiopia Source: Ethiopia DHS2005 Trends in breast feeding practices in Ethiopia Source: Ethiopia DHS2005 Feeding practices for infants under six months, Ethiopia ( Is it optimal according to IYCF guidelines?) Source: Ethiopia DHS2000 Feeding Practices in Ethiopian Infants 6-9 months Source: Ethiopia DHS2000 Dietary diversity of infants and young children in Ethiopia • Dietary diversity refers to : Number of foods or food groups consumed in a defined period (e.g. per day or week) • 7 groups: starchy staples, legumes, dairy, other, flesh foods, VA-rich fruit & veg, other fruits & veg, fats. Dietary diversity and child growth: Africa (DHS data sets) Source: Arimond and Ruel, 2004 Means adjusted for child age, maternal height and BMI, # children < 5 y, and 2 wealth/welfare factor scores Consequences of Malnutrition among children in Ethiopia © 2005 Virginia Lamprecht, Courtesy of Photoshare Four functional consequences Mortality Illness – via increasing susceptibility to illnesses Intelligence loss Reduced productivity Contribution of malnutrition to U5 Mortality in Ethiopia Other 2% Measles 4% AIDS 1% Neonatal 25% Diarrhea 20% Malnutrition 57% HIV/AIDS 11% Malaria 20% Pneumonia 28% «Hidden» death due to malnutrition in Ethiopia 80% of the death due to malnutrition is contributed for by Mild and moderate malnutrition Mild & moderate Severe Only 1 in 5 malnutrition-related deaths is due to severe malnutrition Malnutrition and intellectual development Reduced: • Learning ability • School performance • Retention rates Nutritional problems associated with brain development Prevalence (%) 100 75 54 50 47 38 25 13 0 Goitre Anemia Stunting LBW Consequence of Stunting Reduced productivity 1.4% decrease in productivity for every 1% decrease in height (Haddad & Bouis, 1990) Child Health Nutrition Project of JU-IUC (VLIR-UOS) Rationale of the project • Developed in cognizant with the current trend of health and nutritional problems of children in Ethiopia • Much of the studies done malnutrition are descriptive • Dietary guidelines formulated for Ethiopian children are not based on local study of complementary foods and feeding patterns • Nutrition rehabilitation for severely malnourished children are mostly restricted to hospitals where Primary Health Care Units are appropriate and cost effective Expected outcomes from the project • Development of appropriate complementary feeding strategy based on locally available foods and method of preparation ( processing) • Identifying factors affecting the quality and safety of complementary foods • Contributing to household food security through addressing the problem of post harvest losses • Development of locally appropriate rehabilitation strategy ( dietary + psychomotor) (sustainability and cost effectiveness) Project partners: • The project encompasses different disciplines (sectors) namely, Public Health Nutrition, Pediatrics and Child Health, Agriculture and Food Chemistry ( food technology) • Similar composition of expertise is also obtained from the Belgium Overall objective of the project • Development of human and physical capitals (academic objective) ◦ Public health nutrition , food technology/food science ( lacking in Ethiopia at large) ◦ Research capacity in the areas of nutrition and food science/food technology • Contribute to the improved child growth and development ( development objective) Summary findings from baseline survey on nutritional status and determinants among under 5 children in communities around Gilgel Gibe Hydroelectric dam, Ethiopia March, 2008 Objectives of the study – Determine nutritional status of children Under five years of age – Assess the feeding pattern of target children – Describe the association between feeding patterns with nutritional status Methods • Cross sectional • Representative sample of children between 6 and 59mo • Simple random sampling technique was used • Anthropometry , feeding pattern and general socioeconomic variables were assessed • Data was collected by going house to house Data analysis • Data was entered into SPSS Vr. 16, and analysis was done by both SPSS and Anthro2007 ( WHO, 2007) • Anthropometric measures were converted in to z-score values for comparison with a reference population • Feeding patterns of children was described in relation to IYC feeding guidelines (WHO,2003) • Dietary diversity was calculated for children 623mo old based on the number of food groups consumed the previous 24hrs Result: Socio-demographics Age group (n=364) Frequency Percent 6-11 60 16.5 12-23 87 23.9 24-35 109 29.9 36-47 73 20.1 48-60 35 9.6 Total 364 100.0 Male 187 51.2 Female 178 48.8 Sex (n=365) Background information • 97% of the respondents are biological mothers • 87% of the mothers are unable to read and write • Average no. of U5 children 1.6 • Average birth interval for U5 children (n=314)=2.43 yrs BMI of mothers of index children , kg/m2) (n=350) 3% 23% Chronic energy Deficiency (BMI<18.5kg/msq) Normal (BMI b/n 18.524.99kg/msq) 74% Overweight (BMI >=25kg/msq) Nutritional status of children under five years of age using WHO growth reference (WHO,2007) 45% 23% 13% stunted wasted underweight Type of malnutrition by age in under five children in GGFRC area, 2008 Age group of children U5 years MGRS population ( WHO, 2007) compared with the distribution of malnutrition in Gilgel Gibe area Feeding practice of mothers of index children in the project area Indicators for assessing IYCF practices (623mo) (source: WHO 2007) • Core indicators include: – – – – – – – – Early initiation of breastfeeding Exclusive breastfeeding under 6 months Continued BF at one year Introduction of solid, semi-solid or soft foods at 6 months of age Minimum dietary diversity Minimum meal frequency Minimum acceptable diet ( MAD) Consumption of iron reach and iron fortified foods Feeding pattern of children U5 years • Ever breastfed (n=365): 99.2% • Timing of introduction of the breast milk(n=355): – Immediately after birth= 41% – After the first hour of birth=59% • Average period of EBF (n=361): 3.35 mo • Average time of introduction of other foods or drinks to the child (n=356): 3.37mo Type of additional foods started for U5 children in the study area • Differs for those breastfed and non breastfed children 9% Solid and semi solid foods Liquid complementary foods 91% Dietary diversity for children between 6-23m Minimum dietary diversity: • Proportion of children 6–23 m who receive foods from 4 or more food groups • The 7 foods groups used for tabulation of this indicator are : – Grains, roots and tubers – – – – – – Legumes and nuts Dairy products (milk, yogurt, cheese) Flesh foods Eggs Vitamin-a rich fruits and vegetables Other fruits and vegetables DD in relation to stunting ( n=118) p<001 p<001 Non stunted Minimum acceptable diet (MAD) for children between 6&23 mo • Proportion of children 6–23 months of age who receive a minimum acceptable diet (apart from breast milk) – It is a composite indicator consists of two fraction 1. Breastfed children 6–23 months of age who had at least the minimum dietary diversity and the minimum meal frequency during the previous day out of total breastfed children 6–23 months of age 2. Non-breastfed children 6–23 months of age who received at least 2 milk feedings and had at least the minimum dietary diversity not including milk feeds and the minimum meal frequency during the previous day out of non-breastfed children 6–23 months of age Minimum acceptable diet (MAD) in relation to stunting p<001 p<001 Non stunted Conclusion • There is high rate of undernutrition among infants and young children in Ethiopia and project area • There is poor optimal breast feeding and complementary feeding practices • The quality of the diet is poor as most infants and young children were initiated with liquid CFs • Some indicators of IYCF practice are associated with stunting Conclusion… • Malnutrition is the major single cause of death in children in Ethiopia • Malnutrition usually operates synergistically with infection ( But both can lead to death directly) • Programmatically both should be addressed as the same time to reduce infant mortality in Ethiopia UNICEF/C-55-38/Watson THANK YOU !!!

