Chapter 13: Taxation and Efficiency
advertisement
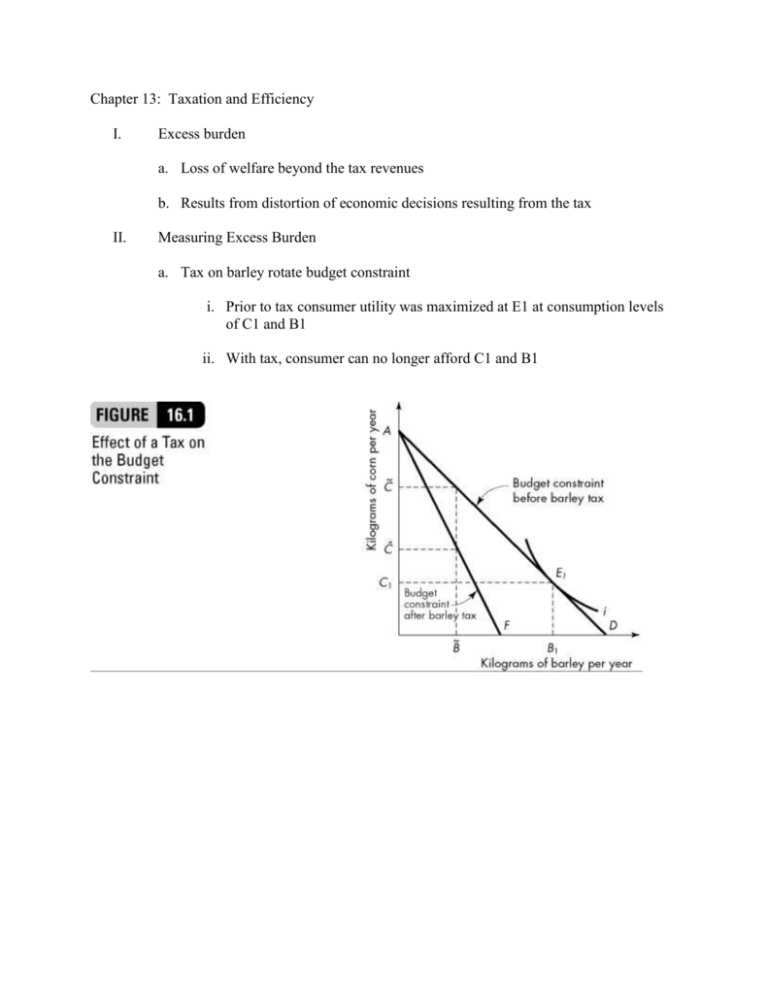
Chapter 13: Taxation and Efficiency I. Excess burden a. Loss of welfare beyond the tax revenues b. Results from distortion of economic decisions resulting from the tax II. Measuring Excess Burden a. Tax on barley rotate budget constraint i. Prior to tax consumer utility was maximized at E1 at consumption levels of C1 and B1 ii. With tax, consumer can no longer afford C1 and B1 b. With tax consumer utility is maximized at E2 with consumption of C2 and B2 i. Consumer has moved from utility level i to ii c. Measure the equivalent variation i. Reduction in income that would place the consumer on the same indifference curve as the tax ii. Tax income equivalent of the tax moves the consumer to E3 and consumption level C3 and B3 iii. Excess burden is distance E2N iv. The logic is that the tax changes the relative prices of good and causes the consumer to consume a bundle of goods different from the preferred bundle thus creating a welfare loss. III. Lump sum tax a. Tax that doesn’t change behavior b. Has no excess burden c. Regressive nature of tax makes it politically unpopular IV. Income tax a. Has no excess burden if tax does not change people’s behavior b. People work and earn as much after the tax as they did before c. Evidence is that people change behavior in response to income taxes V. Tax on products with inelastic demand a. Consumption remains same after tax as before b. Still have excess burden since reduce consumption of other products VI. Impact of tax divided into two components a. Income effect – change in consumption due to reduction in income b. Substitution effect – change in consumption due to change in relative prices VII. Excess Burden measured with demand curves a. The deadweight loss associated with a tax measures the excess burden of a tax b. Measured using compensated demand curves i. Every price change has two effects 1. Substitution effect – results from the change in the relative prices of the goods 2. Income effect – results from increase/decrease in income caused by the price change. ii. Compensated demand curve is the demand curve that results from the substitution effect alone. iii. Example: Demand for gasoline if government reimbursed consumer for the gasoline taxes paid. 1. The check eliminates the income effect leaving only the substitution effect iv. Compensated demand curves difficult to derive v. For most goods income effect is small so often ignored in practice c. Measured the same as done in chapter 12 - Figure 13.5 VIII. Excess burden of a subsidy a. A subsidy has an excess burden like a tax b. In this case the price distortion causes more consumption of the product than is economically desirable. c. Example: Qd = 500 – 10P and Qs = 20P – 100. A $6 subsidy is applied IX. Differential taxation of inputs a. Taxing inputs differentially skews the production decision b. Example: Mortgage interest deduction i. Results in more single family homes being constructed ii. Results n less multifamily houses being constructed iii. Excess burden exists to the extent decision is skewed.
