PEER Module Test Template
advertisement
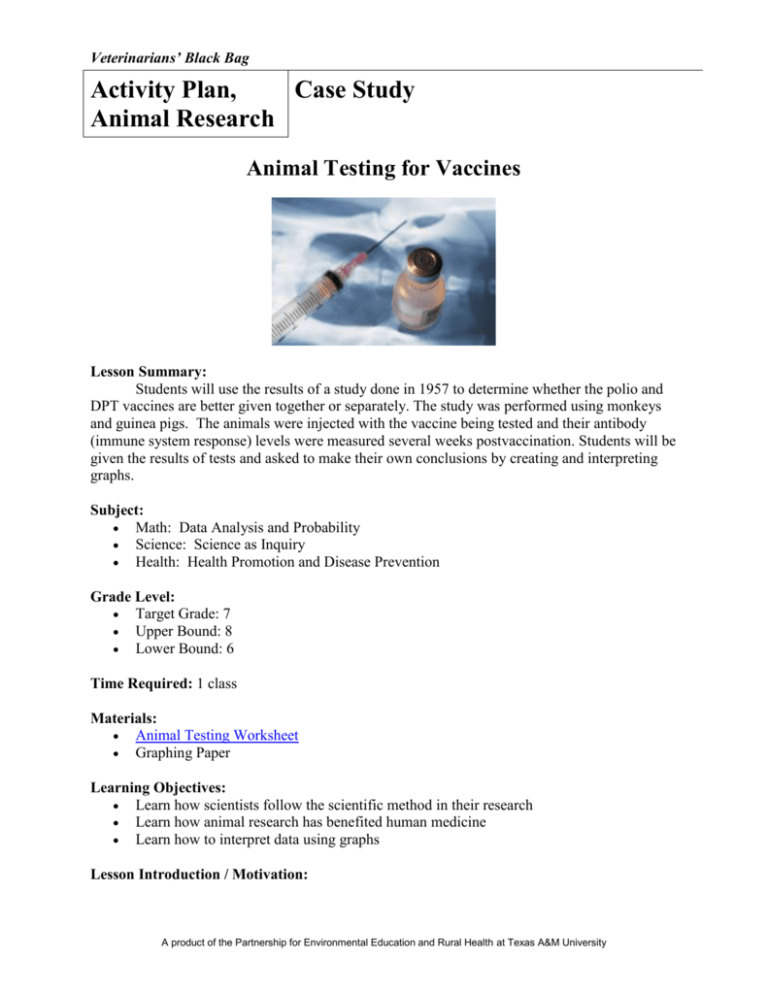
Veterinarians’ Black Bag Activity Plan, Case Study Animal Research Animal Testing for Vaccines Lesson Summary: Students will use the results of a study done in 1957 to determine whether the polio and DPT vaccines are better given together or separately. The study was performed using monkeys and guinea pigs. The animals were injected with the vaccine being tested and their antibody (immune system response) levels were measured several weeks postvaccination. Students will be given the results of tests and asked to make their own conclusions by creating and interpreting graphs. Subject: Math: Data Analysis and Probability Science: Science as Inquiry Health: Health Promotion and Disease Prevention Grade Level: Target Grade: 7 Upper Bound: 8 Lower Bound: 6 Time Required: 1 class Materials: Animal Testing Worksheet Graphing Paper Learning Objectives: Learn how scientists follow the scientific method in their research Learn how animal research has benefited human medicine Learn how to interpret data using graphs Lesson Introduction / Motivation: A product of the Partnership for Environmental Education and Rural Health at Texas A&M University Veterinarians’ Black Bag: Activity Plan, Animal Research Ask the students how many of them have received shots before. The majority of students should have received the DPT and polio vaccinations as a baby. The DPT vaccination helps protect them from diphtheria, pertussis, and tetanus. The polio vaccine has helped to nearly eradicate the polio virus. Polio became a problem in the U.S. in the early 1900’s but thanks to research, including tests done on animals, a vaccine was developed. The Sabin vaccination, named for its inventor Albert Sabin, became the official polio vaccine in 1962. Sabin created his oral vaccine through research on monkeys. Today the students will draw conclusions from a study from the 1950’s testing monkeys and guinea pigs to determine whether the DPT and polio vaccines were more effective when given together or separately. Background Information: This lesson plan is based on a study done in the 1950’s on whether the DPT and polio vaccines were more effective when given together or separately. The tests were run on guinea pigs and monkeys over a few weeks. The animals were separated into three groups: one that received just the DPT vaccine, one that received just the polio vaccine and one that received both the DPT and polio vaccines. Each guinea pig received three shots in total over the course of the study (the second two weeks after the first and the third eight weeks after the second). Each monkey received four shots in total over the course of the study (the second two weeks after the first, the third seven weeks after the second and the fourth six weeks after the third). The scientists tested every animal’s blood for antibodies two weeks after each injection. So the guinea pigs’ blood was tested on the 2nd, 4th and 8th weeks and the monkeys’ blood on the 2nd, 4th, 11th and 17th weeks. Polio is a disease caused by three separate strains. To be immune to polio the subject must have antibodies to all three strains. So when testing how well the polio vaccine worked the scientists tested for the three different antibodies – named Type I, II and III – to fully determine the effectiveness of the vaccine. To test how effective these vaccines were, the scientists measured the amount of antibodies in the animals’ blood (*Note: The study actually studied the agglutinins, which are a type of antibody). The more antibodies in the blood the better the vaccine worked. Lesson Plan: Explain to the students that they will be using the results of a lab study to determine whether the DPT and polio vaccines are more effective when given together or separately. To test this, scientists tested both monkeys and guinea pigs. Have the students review the scientific method: Stating the problem Gathering information on the problem Forming a hypothesis Performing experiments to test the hypothesis Recording and analyzing data Stating a conclusion Repeating the work Show how the scientists, and now the students, followed this method: Stating the problem – are the DPT and polio vaccines more effective given together or separately A product of the Partnership for Environmental Education and Rural Health at Texas A&M University Veterinarians’ Black Bag: Activity Plan, Animal Research Gathering information on the problem – see what tests have been done in the past Forming a hypothesis – have the students hypothesize which they think will be the outcome of the tests Performing experiments to test the hypothesis – this is what the scientists did, but have the students say how they would test their hypothesis Recording and analyzing data – this is what the students are about to do with the data from the tests Stating a conclusion – this is what the students will do once they finish analyzing the data Repeating the work – this is where other scientists can verify the work The results of the study are given in the results file. In the study the mean of the different groups was determined by finding the geometric mean, however the students will just need to find the average. At this time give the students the Animal Testing Worksheet for them to calculate the averages for each test. After the students finish this they should be able to graph the averages versus the weeks. This will generate four graphs for both the guinea pigs and monkeys: Pertussis, Polio Type I, Polio Type II and Polio Type III. Examples of each of these are in the results.xls file. After they have finished graphing the results, ask them to make their own conclusions on the Animal Testing Worksheet. An interesting thing that should be observed is that the polio vaccine worked better than the combination of the two in guinea pigs, but it was the opposite in monkeys. This may throw some students off, but use this to ask them what they think it means: Which animal would be a better representation of human response? Is there any conclusive evidence why this happened? What should be done about this? Lesson Closure: Today both the DPT and polio vaccines are given to humans, but not together. Vocabulary / Definitions: Antibody – a protein molecule which fights bacteria or viruses in the body which is produced by the immune system in response to the presence of a disease causing agent (or vaccine) Pertussis – more commonly known as whooping cough, this is a disease which affects the respiratory system Diphtheria – a disease which attacks the nose and throat, it is potentially life threatening Tetanus – a disease caused by the toxin produced by a bacteria, the toxin attacks the nervous control of muscles causing the muscles to become rigid (aka lockjaw). It is fatal if not treated. Polio – a viral disease which can cause paralysis and permanent disability Lesson Scaling: For 8th graders the geometric mean could be calculated the same way as the original study did. This is done by multiplying all the results together, then raising that product to the inverse of the number of results: Geometric Mean = (a*b*…..*c)^(1/n) A product of the Partnership for Environmental Education and Rural Health at Texas A&M University Veterinarians’ Black Bag: Activity Plan, Animal Research Multimedia Support and Attachments: Animal Testing Worksheet References: photo from http://office.microsoft.com/clipart/results.aspx?lc=enus&Scope=MC%2CMM%2CMP%2CMS&Query=vaccine The study that is referenced by this activity is Kendrick, Pearl L.; Brown, Gordon C. APHA. 1957, 47(4), 473-484. TEKS: Math 6.10 (A) Draw and compare different graphical representations of the same data 6.10 (B) Describe data using median, mode, and range 6.10 (D) Collect, organize, display, and interpret data to solve problems 6.12 (A) Communicate mathematical ideas using words, graphs, models 6.13 (A) Make conjectures from patterns or sets of examples and non-examples 7.12 (B) Choose among mean, median, mode, or range to describe a set of data 7.14 (A) Communicate mathematical ideas through various means 7.15 (A) Make conjectures from patterns or sets of examples or non-examples 8.12 (B) Draw conclusions and make predictions by analyzing a scatterplot 8.14 (B) Use problem-solving model 8.14 (C) Select an appropriate problem solving strategy 8.14 (D) Select from among various tools to solve problems 8.15 (A) Communicate mathematical ideas using language, tools, and models 8.15 (B) Evaluate the effectiveness of different representations to communicate 8.16 (A) Make conjectures from patterns or sets of examples and non-examples Science 6.2 (C) Analyze and interpret information to construct reasonable explanations 6.2 (D) Communicate valid conclusions 6.2 (E) Construct graphs, tables, maps, and charts to evaluate data 6.3 (A) Analyze, review, and critique scientific explanations 7.2 (C) Organize, analyze, make inferences, and predict trends from evidence 7.2 (D) Communicate valid conclusions 7.3 (A) Analyze, review, and critique explanations 8.2 (C) Organize, analyze, evaluate, make inferences, and predict trends 8.2 (D) Communicate valid conclusions 8.2 (E) Construct visuals using tools to organize, examine, and evaluate data 8.3 (A) Analyze, review, and critique scientific explanations using evidence 8.3 (D) Evaluate research’s impact on science, society, and the environment 8.4 (B) Extrapolate from collected information to make predictions Health 7-8.3 (A) Explain the role of preventive health measures in disease prevention A product of the Partnership for Environmental Education and Rural Health at Texas A&M University Veterinarians’ Black Bag: Activity Plan, Animal Research A product of the Partnership for Environmental Education and Rural Health at Texas A&M University
