The Michelson Morley Experiment
advertisement
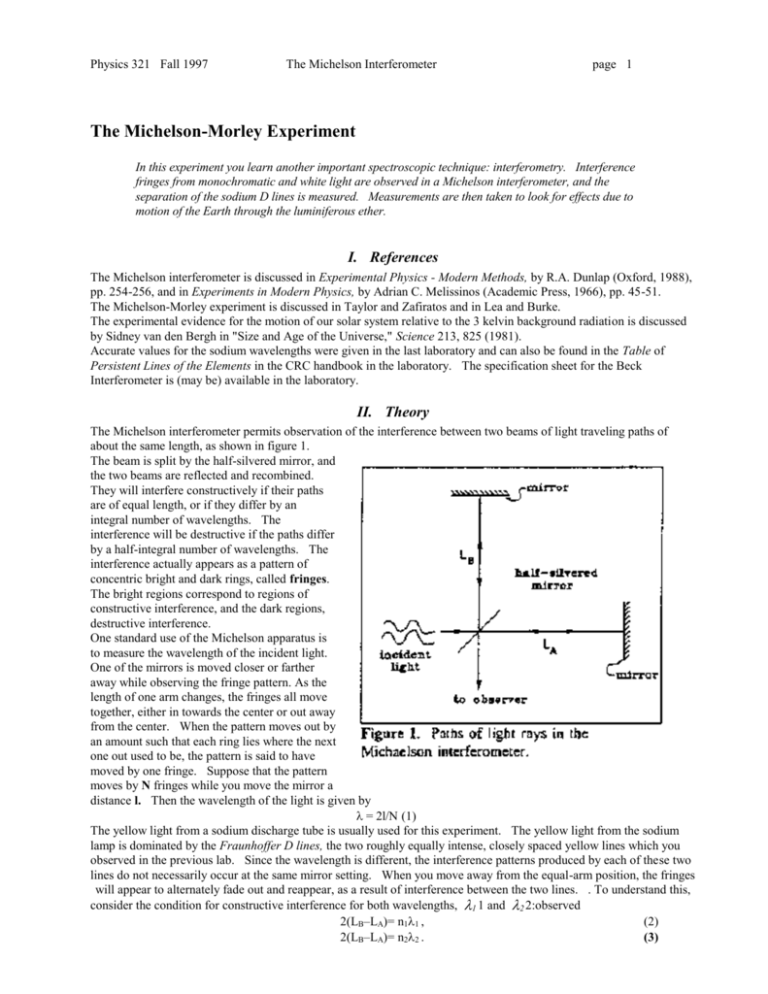
Physics 321 Fall 1997 The Michelson Interferometer page 1 The Michelson-Morley Experiment In this experiment you learn another important spectroscopic technique: interferometry. Interference fringes from monochromatic and white light are observed in a Michelson interferometer, and the separation of the sodium D lines is measured. Measurements are then taken to look for effects due to motion of the Earth through the luminiferous ether. I. References The Michelson interferometer is discussed in Experimental Physics - Modern Methods, by R.A. Dunlap (Oxford, 1988), pp. 254-256, and in Experiments in Modern Physics, by Adrian C. Melissinos (Academic Press, 1966), pp. 45-51. The Michelson-Morley experiment is discussed in Taylor and Zafiratos and in Lea and Burke. The experimental evidence for the motion of our solar system relative to the 3 kelvin background radiation is discussed by Sidney van den Bergh in "Size and Age of the Universe," Science 213, 825 (1981). Accurate values for the sodium wavelengths were given in the last laboratory and can also be found in the Table of Persistent Lines of the Elements in the CRC handbook in the laboratory. The specification sheet for the Beck Interferometer is (may be) available in the laboratory. II. Theory The Michelson interferometer permits observation of the interference between two beams of light traveling paths of about the same length, as shown in figure 1. The beam is split by the half-silvered mirror, and the two beams are reflected and recombined. They will interfere constructively if their paths are of equal length, or if they differ by an integral number of wavelengths. The interference will be destructive if the paths differ by a half-integral number of wavelengths. The interference actually appears as a pattern of concentric bright and dark rings, called fringes. The bright regions correspond to regions of constructive interference, and the dark regions, destructive interference. One standard use of the Michelson apparatus is to measure the wavelength of the incident light. One of the mirrors is moved closer or farther away while observing the fringe pattern. As the length of one arm changes, the fringes all move together, either in towards the center or out away from the center. When the pattern moves out by an amount such that each ring lies where the next one out used to be, the pattern is said to have moved by one fringe. Suppose that the pattern moves by N fringes while you move the mirror a distance l. Then the wavelength of the light is given by = 2l/N (1) The yellow light from a sodium discharge tube is usually used for this experiment. The yellow light from the sodium lamp is dominated by the Fraunhoffer D lines, the two roughly equally intense, closely spaced yellow lines which you observed in the previous lab. Since the wavelength is different, the interference patterns produced by each of these two lines do not necessarily occur at the same mirror setting. When you move away from the equal-arm position, the fringes will appear to alternately fade out and reappear, as a result of interference between the two lines. . To understand this, consider the condition for constructive interference for both wavelengths, 1 1 and 2 2:observed 2(LB–LA)= n11 , (2) 2(LB–LA)= n22 . (3) Physics 321 Fall 1997 The Michelson Interferometer page 2 where n1 and n2 are integers, and LA and LB are defined in figure 1. Now, if LB is changed to LB' by moving the mirror until the two lines again interfere constructively, n2 will have increased by one more than n1. Say that n1 increases by n 4 fringes. Then the interference conditions have become 2(L'B–LA)= (n1+n)1 , (4) 2(L'B–LA)= (n2+n+1)2 . (5) These four equations can be solved to express =5 2 – 1 in terms of n6. Combining equations (2) and (3) and equations (4) and (5) gives n11=n22 (6) (n1+n)1 =(n2+n+1)2 (7) Subtracting these equations and solving for 8 gives =2 / n (8) (You should repeat, in your notebook, this calculation yourself.) To reproduce the Michelson-Morley ether drift experiment, interference fringes are observed as the apparatus is rotated through 90o, so that the arm initially parallel to the motion of the ether becomes perpendicular to it. One expects a shift of the fringe pattern similar to that observed when the length of one of the arms is changed. The expected fringe shift n is given by 2L v2 n= , c2 (9) where L is the length of the arms of the interferometer (one way), and v is the velocity of the motion through the ether. (See T&Z, Lea and Burke, or Tipler for a derivation (see Section 1.5, pp.7-11, of Taylor and Zafiratos. Also review problems 1.15 and 1.16.)) In order to test for motion through the ether, one should orient the apparatus parallel and perpendicular to the motion of the earth relative to the ether. One could orient parallel and perpendicular to the motion of the earth on its axis. Or one could orient parallel and perpendicular to the motion of the earth about the sun. More properly, one might orient relative to the motion of the sun itself. The sun is moving at about 400 km/sec towards the constellation Virgo. Since you are pretty well constrained to measuring in a plane parallel to the surface of the earth, which you choose is somewhat arbitrary, so long as you present justification. If you have time and do want to go through what is needed to locate the direction of Virgo, see the appendix. III. Procedure A. Setting up. Look over the apparatus, and try to understand all of its motions and adjustments. You may need to put in the pin which pushes the movable mirror forward. Check to see that both ends of the pin are centered on their mating pieces; otherwise the lever motion will be uncalibrated. PLEASE REMOVE IT AT THE END OF THE DAY, to avoid fatiguing the spring. Refer if necessary to the Beck specification sheet for the correct configuration of mirrors, etc., if you need to. Turn on the sodium lamp. It takes a while to warm up. Illuminate the ground-glass screen with the sodium light, and look for the fringes. You will probably need to adjust the tiltable mirror to center the fringe pattern. You will also need to move the translatable mirror. It helps in aligning the mirror to have something to look at, like a piece of wire, behind the ground-glass plate. The arms are of equal length when the fringes are as sharp as possible and as widely spaced as possible. As the paths for the light become equal the width of the fringes increases until only one or two fringes fill the viewing aperture. B. Measurement of the sodium D-line wavelength. To measure the wavelength of the D line, you want to move the mirror of the interferometer a known distance, and to count the number of fringes by which the fringe pattern shifts. The micrometer measures motion of the lever which moves the mirror. Note that the end of the lever moves exactly five times farther than the mirror does. Also, remember that the light path is double the distance moved by the mirror! To make a measurement: (1) Read the micrometer; you will need to interpolate to tenths of divisions to get an accurate result. Remember always to move the micrometer in the same direction just before reading it, to avoid backlash error. (2) Move the micrometer slowly, watching the fringe pattern and counting the fringes. It is suggested that you move exactly 100 fringes. However, many students find that the eyestrain caused by trying to count 100 fringes causes inaccuracies. Thus you may do better by moving say 25 fringes 4 times as many rather than the 100 Physics 321 Fall 1997 The Michelson Interferometer page 3 fringes. You will probably require a bit of practice before you can accomplish this smoothly. (3) Read the micrometer again, and subtract readings. (4) Before repeating the procedure, move the micrometer a bit, so that you don't use the same part of its motion for the next measurement. The procedure should be repeated several times, in order to estimate the error. Note that you may also make counting errors, especially on your first tries. When you have a number of readings that you think are reliable, average them to get your best estimate for the sodium-D wavelength (call this value x9). You should calculate an error, too. The following is suggested: (a) Determine the error x10 on the motion x for a single 100-fringe measurement, either by calculating the r.m.s. spread of the values, or by estimating it. (b) Calculate the error x11 on the mean value x12. (For N independent measurements, x =x /N13.) (c) The error on the value 14 is the same, percentage-wise, as the error on x15. C. The separation of the sodium D lines. As explained in the theory section, the yellow light from the sodium lamp consists mainly of two closely spaced yellow lines of about equal intensity, the Fraunhoffer D lines. The interference from these two lines is not always in phase. Look at the change in the fringe pattern as you move away from the equal-arm position. The fringes should alternately fade out and reappear. This is because the line is double. To measure the spacing of these lines, start by determining x16, the distance the mirror moves as the pattern changes from washed-out fringes through bright fringes back to washed-out fringes. If you go through several cycles, the measurement will be more accurate. Then calculate n17, the number of fringes of motion for one cycle. It is easy to show that n = x/(5/2 ) Here you might as well use the accepted value for 19. Then use the formula from the theory section to calculate 20, the splitting of this line. For error analysis, repeating the measurement is the best method! Compare your result with accepted values from the CRC Handbook. This is an elegant technique for measuring line separations too small to see with a spectroscope. Note that the closer the lines, the bigger21 n, and so the more accurate the measurement! D. White-light fringes Using sodium light, adjust the arms to be as nearly equal as possible (widest fringes). Keep comparing fringe maxima between settings of the arms where the fringes are clearest, i.e., where the interference from the two lines are in phase. When you find maxima where the central fringe almost fills the field of view, you are probably within a maxima or so, plus or minus. Then try to find fringes using white light from a tensor lamp. Pass the light through a ground-glass diffusing plate.) The white-light fringes are elusive, but beautiful. Give up? Try putting in a band-pass filter – or ask the instructor. The band-pass filter selects a narrow band of light, and so increases the coherence length of the light. This results in interference fringes even when the two arms are not precisely equal. The white light fringes are an early case of where you should make accurate qualitative observations, and where you should attempt to explain, in your notebook, what is going on. Why do the colors appear as one goes away from the equal-arm-length position? Why do the colors appear as complementary, rather than primary? Does your explanation agree with what you observe? Could you describe in detail to someone else what you saw, based on your notes? E. Other games. You might be amused to try verifying the following facts about fringes: As the difference in the length of the arms decreases, the circular fringes shrink inward; as the difference increases, they expand outward. The radius of the nth ring out from the center of the pattern follows the law rn = r0 n (9) where r0 = D (/d) (10) here D is the distance from your eye to the image of the fringes, and d is the difference in length of the two arms. You can see, for example, that the fringe spacing increases as d decreases. F. Detecting the luminiferous ether. If your apparatus is moving with respect to a luminiferous ether, you should see a fringe shift when you rotate the apparatus by 90o. (See discussion under `Theory'.) You can do this by mounting it on a rotating platform. Try this, and estimate a fringe shift, and error, for a 90o rotation. Make sure that one arm of your apparatus points more or less towards the constellation Virgo. To observe the fringes in a reproducible way you may want to put a crosshair (thread?), or a pinhole to look through, on the viewing telescope. Physics 321 Fall 1997 The Michelson Interferometer page 4 Calculate the fringe shift expected if we are moving through an ether at 400 km/sec. You should be able to predict which way the fringes should shift when you rotate the apparatus. Compare your observed fringe shift with what is predicted by the ether theory. Is there a disagreement? By how many standard deviations? IV. Apparatus Beck interferometer sodium lamp tensor lamp ground-glass plate bandpass filter (505-543 nm works well) Beck instruction book Beck interferometer catalogue rotating table (one grating spectrometer may be set up in the lab to show the sodium spectrum.) _______________________________________________ Astronomical Appendix. (With thanks to Prof. Charles Hagar!) The location of interesting astronomical objects is given by specifying their right ascension (22) and declination (23). In brief, the following is intended to give the minimum of astronomical terms and formulas necessary to figure out where to look to see something, based on its right ascension and declination. The right ascension is an azimuthal angle about an axis through the north star, measured in hours, eastward from an arbitrary reference point (determined by where the sun is found at the vernal equinox). Declination is a polar angle, in degrees, measured from the celestial equator. What you need to know to find the object, at a given time and at a given place on the globe, is the hour angle. This is an azimuthal angle to the object, measured like right ascension but westward from overhead, rather than eastward from the vernal equinox. Here are some of the terms used: RA (24) = right ascension, measured in hours eastwards from the vernal equinox declination (25) = a polar angle, measured from the celestial equator HA = hour angle, measured along the celestial equator from the meridian Local Sidereal Time (LST) = hour angle of the vernal equinox where you are. The hour angle can be calculated from HA = LST - . The local sidereal time can be calculated from LST=HA of the mean sun + RA of the mean sun. Here the hour angle of the mean sun is found from HA of the mean sun= PST–10m–12h. (The ten-minute correction is specific to San Francisco.) The right ascension of the mean sun depends on the period of the calendar, and can be calculated from RA of the mean sun= 2h*N+ 4h*n, where N is the number of whole months since March 21 (the date of the vernal equinox), and n is the number of extra days. Example: For September 1, N=5, n=11, and RA mean sun = 10h44m. The Sun is thought to be moving at about 400 km/sec towards the constellation Virgo. The speed of the Earth's motion about the sun, approximately 30 km/sec, can be neglected. The interferometer should be aligned so that one of its arms points as nearly as possible towards Virgo. The right ascension and declination of the Virgo cluster are =12h30m, =+1326. The hour angle (or HA, measured westward from overhead) of the Virgo cluster at typical lab times is given in the table below. The local sidereal time (LST) is also given; the hour angle is given by HA = LST – 27. Date Time Local Sidereal Time Hour Angle September 1 15:30 PST 14h4m 1h34m February 1 15:30 PST 0h4m 11h34m Physics 321 Fall 1997 The Michelson Interferometer _______________________________________________ page 5
