doc
advertisement
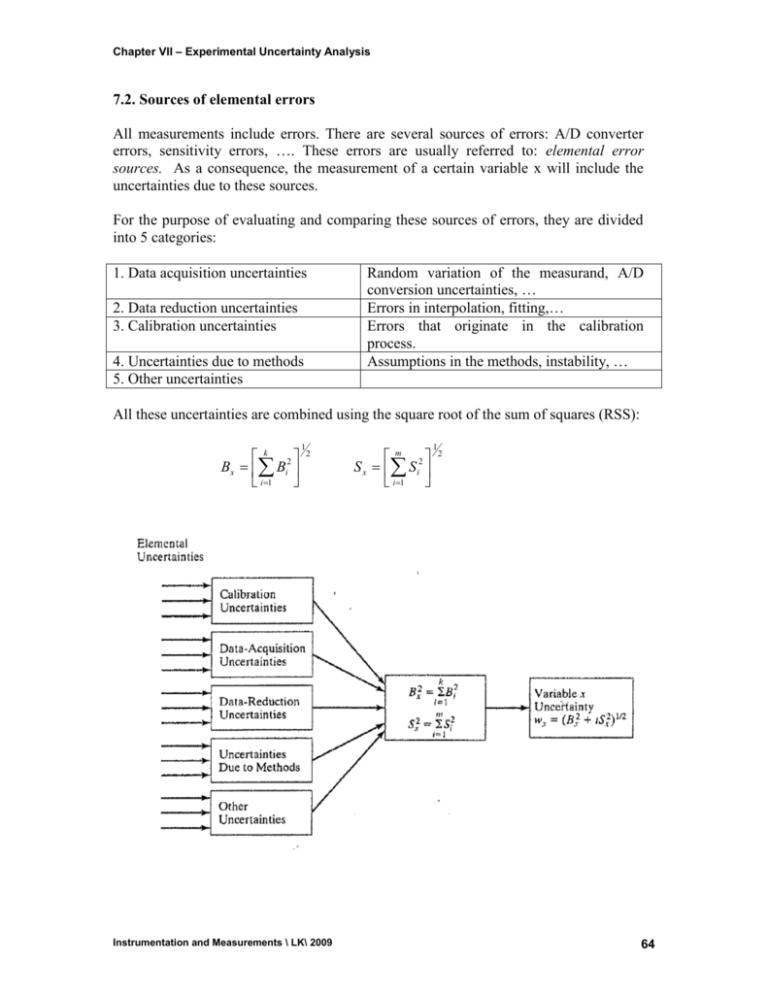
Chapter VII – Experimental Uncertainty Analysis 7.2. Sources of elemental errors All measurements include errors. There are several sources of errors: A/D converter errors, sensitivity errors, …. These errors are usually referred to: elemental error sources. As a consequence, the measurement of a certain variable x will include the uncertainties due to these sources. For the purpose of evaluating and comparing these sources of errors, they are divided into 5 categories: 1. Data acquisition uncertainties 2. Data reduction uncertainties 3. Calibration uncertainties 4. Uncertainties due to methods 5. Other uncertainties Random variation of the measurand, A/D conversion uncertainties, … Errors in interpolation, fitting,… Errors that originate in the calibration process. Assumptions in the methods, instability, … All these uncertainties are combined using the square root of the sum of squares (RSS): k Bx Bi2 i 1 1 2 Instrumentation and Measurements \ LK\ 2009 m S x S i2 i 1 1 2 64 Chapter VII – Experimental Uncertainty Analysis NOTE: For the determination of random uncertainties, we need t-distribution if n < 30. However, sometimes the input elemental random uncertainties are based on different sample sizes. In this case a combined value for is computed using Welch-Satterhwaite formula: m 2 Si v x m i 1 Si4 / vi i 1 Example One of the methods for measuring the power (P) of rotating machinery is to measure the rotational speed and the rotational shaft torque and then calculate the power transmitted through the shaft. The formula for the power is: P , where is the torque, (= 2 N ) is the rotational speed in radians per second, and N is the number of revolutions per second. From the measurement of the power of a small engine, the following information is available: As per the manufacturer’s information, the accuracy of the torque meter is 0.7 N-m and the accuracy of the rotational speed-meter is 5 rpm. The mean values of the measured torque and rotational speed are 165 N-m and 3000 rpm, respectively. In repeating the speed and torque measurements, it is found that the standard deviations of these measurements are 4 N-m and 5 rpm, respectively. a) Calculate the mean value of the power of the engine. b) If the number of samples used for calculating the standard deviations of the torque and speed are 10 and 20, respectively, calculate the standard deviation of the power. c) Calculate the random and systematic uncertainty of the power. d) Calculate the total uncertainty of the power at a 95% confidence level. Instrumentation and Measurements \ LK\ 2009 65
