Beverage Marketing Corporation
THE 2007 STATS
Source: Commentary and content provided by Beverage Marketing Corporation
Bottled Water Continues As Number 2 in 2007
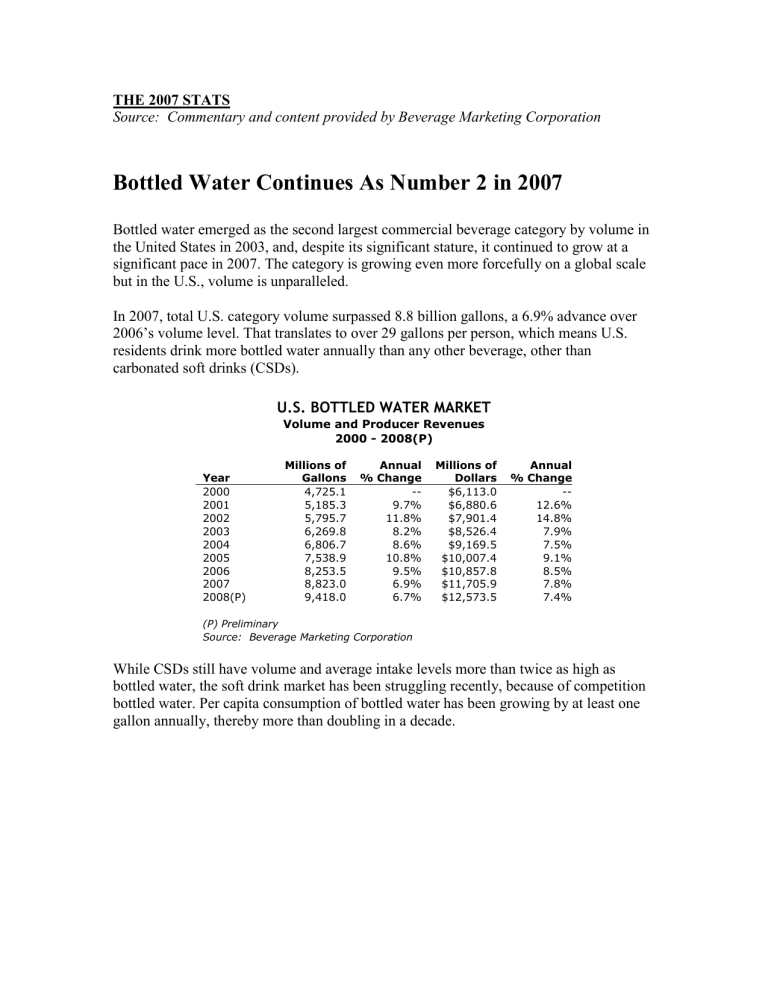
Bottled water emerged as the second largest commercial beverage category by volume in the United States in 2003, and, despite its significant stature, it continued to grow at a significant pace in 2007. The category is growing even more forcefully on a global scale but in the U.S., volume is unparalleled.
In 2007, total U.S. category volume surpassed 8.8 billion gallons, a 6.9% advance over
2006’s volume level. That translates to over 29 gallons per person, which means U.S. residents drink more bottled water annually than any other beverage, other than carbonated soft drinks (CSDs).
U.S. BOTTLED WATER MARKET
Year
2000
2001
2002
2003
2004
2005
2006
2007
2008(P)
Volume and Producer Revenues
2000 - 2008(P)
Millions of Annual Millions of
Gallons % Change
Annual
Dollars % Change
4,725.1
5,185.3
5,795.7
6,269.8
6,806.7
7,538.9
8,253.5
8,823.0
9,418.0
--
9.7%
11.8%
8.2%
8.6%
$6,113.0
$6,880.6
$7,901.4
$8,526.4
$9,169.5
10.8% $10,007.4
9.5% $10,857.8
6.9% $11,705.9
6.7% $12,573.5
(P) Preliminary
Source: Beverage Marketing Corporation
--
12.6%
14.8%
7.9%
7.5%
9.1%
8.5%
7.8%
7.4%
While CSDs still have volume and average intake levels more than twice as high as bottled water, the soft drink market has been struggling recently, because of competition bottled water. Per capita consumption of bottled water has been growing by at least one gallon annually, thereby more than doubling in a decade.
U.S. BOTTLED WATER MARKET
Per Capita Consumption
1997 – 2007
Gallons Annual
Year
1997
1998
1999
2000
2001
2002
2003
Per Capita % Change
13.5 --
14.7
16.2
16.7
18.2
20.1
21.6
8.3%
10.2%
3.5%
8.6%
10.6%
7.2%
2004
2005
2006
2007
23.2
25.4
27.6
29.3
7.5%
9.7%
8.4%
6.4%
Source: Beverage Marketing Corporation
Year
U.S. BOTTLED WATER MARKET
Volume and Growth by Segment
2000 – 2007
2000
2001
2002
2003
2004
2005
2006
2007
4,443.0
4,917.3
5,487.5
5,923.9
6,411.3
7,171.4
7,899.9
8,435.7
--
10.7%
11.6%
8.0%
8.2%
11.9%
10.2%
6.8%
* Millions of gallons
Source: Beverage Marketing Corporation
144.2
144.0
149.5
152.6
166.8
185.0
189.3
201.2
Nonsparkling Domestic Sparkling Imports Total
Volume* Change Volume* Change Volume* Change Volume* Change
--
-0.1%
3.8%
2.1%
9.3%
10.9%
2.3%
6.3%
137.9
123.9
158.7
193.3
228.6
182.5
164.3
186.0
-- 4,725.1
-10.1% 5,185.3
28.0% 5,795.7
21.8% 6,269.8
18.2% 6,806.7
-20.2% 7,538.9
-10.0% 8,253.5
13.2% 8,823.0
--
9.7%
11.8%
8.2%
8.6%
10.8%
9.5%
6.9%
GLOBAL BOTTLED WATER MARKET
Leading Countries' Consumption and Compound Annual Growth Rates
2002 – 2007
2007
Rank Countries
Millions of Gallons
2002 2007
CAGR*
2002/07
7
8
9
10
1
2
3
4
5
6
United States
Mexico
China
Brazil
Italy
Germany
Indonesia
France
Thailand
Spain
Top 10 Subtotal
All Others
5,795.6
3,898.6
2,138.4
2,541.8
2,558.2
2,291.5
1,622.5
2,225.6
1,277.0
1,191.4
25,540.7
9,054.2
8,823.0
5,885.2
4,787.8
3,621.1
3,100.9
2,743.2
2,400.6
2,283.2
1,533.1
1,284.0
36,462.2
13,407.3
8.8%
8.6%
17.5%
7.3%
3.9%
3.7%
8.2%
0.5%
3.7%
1.5%
7.4%
8.2%
WORLD TOTAL
* Compound annual growth rate
Source: Beverage Marketing Corporation
34,594.9 49,869.6 7.6%
GLOBAL BOTTLED WATER MARKET
Per Capita Consumption by Leading Countries
2002 – 2007
13
14
15
16
17
18
19
20
2007
Rank Countries
1 United Arab Emirates
2
3
4
Mexico
Italy
Belgium-Luxembourg
9
10
11
12
5
6
7
8
France
Germany
Spain
Lebanon
United States
Hungary
Switzerland
Slovenia
Austria
Czech Republic
Croatia
Saudi Arabia
Cyprus
Thailand
Israel
Portugal
Gallons Per Capita
2002
35.2
2007
68.6
37.7
44.2
32.7
54.1
53.3
39.5
37.1
27.8
29.7
24.9
20.1
13.5
24.2
18.8
35.8
33.3
31.7
29.3
29.3
28.5
28.2
25.2
20.9
21.1
14.9
23.8
21.4
20.1
12.4
19.9
25.0
24.6
24.3
24.1
24.0
23.6
23.2
22.4
GLOBAL AVERAGE
Source: Beverage Marketing Corporation
5.6 7.6
