Assignment1
advertisement

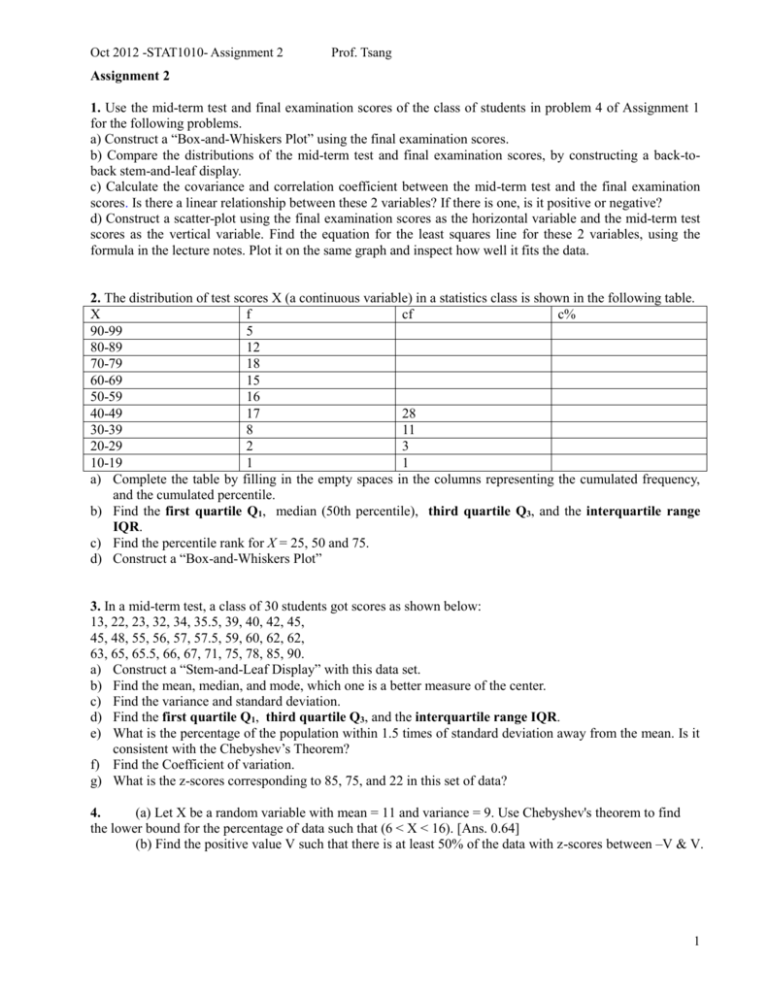
Oct 2012 -STAT1010- Assignment 2 Prof. Tsang Assignment 2 1. Use the mid-term test and final examination scores of the class of students in problem 4 of Assignment 1 for the following problems. a) Construct a “Box-and-Whiskers Plot” using the final examination scores. b) Compare the distributions of the mid-term test and final examination scores, by constructing a back-toback stem-and-leaf display. c) Calculate the covariance and correlation coefficient between the mid-term test and the final examination scores. Is there a linear relationship between these 2 variables? If there is one, is it positive or negative? d) Construct a scatter-plot using the final examination scores as the horizontal variable and the mid-term test scores as the vertical variable. Find the equation for the least squares line for these 2 variables, using the formula in the lecture notes. Plot it on the same graph and inspect how well it fits the data. 2. The distribution of test scores X (a continuous variable) in a statistics class is shown in the following table. X f cf c% 90-99 5 80-89 12 70-79 18 60-69 15 50-59 16 40-49 17 28 30-39 8 11 20-29 2 3 10-19 1 1 a) Complete the table by filling in the empty spaces in the columns representing the cumulated frequency, and the cumulated percentile. b) Find the first quartile Q1, median (50th percentile), third quartile Q3, and the interquartile range IQR. c) Find the percentile rank for X = 25, 50 and 75. d) Construct a “Box-and-Whiskers Plot” 3. In a mid-term test, a class of 30 students got scores as shown below: 13, 22, 23, 32, 34, 35.5, 39, 40, 42, 45, 45, 48, 55, 56, 57, 57.5, 59, 60, 62, 62, 63, 65, 65.5, 66, 67, 71, 75, 78, 85, 90. a) Construct a “Stem-and-Leaf Display” with this data set. b) Find the mean, median, and mode, which one is a better measure of the center. c) Find the variance and standard deviation. d) Find the first quartile Q1, third quartile Q3, and the interquartile range IQR. e) What is the percentage of the population within 1.5 times of standard deviation away from the mean. Is it consistent with the Chebyshev’s Theorem? f) Find the Coefficient of variation. g) What is the z-scores corresponding to 85, 75, and 22 in this set of data? 4. (a) Let X be a random variable with mean = 11 and variance = 9. Use Chebyshev's theorem to find the lower bound for the percentage of data such that (6 < X < 16). [Ans. 0.64] (b) Find the positive value V such that there is at least 50% of the data with z-scores between –V & V. 1 Oct 2012 -STAT1010- Assignment 2 Prof. Tsang 5. The result of a national survey showed that on average, adults sleep 6.9 hours per night, with a standard deviation of 1.1 hours. Use Chebyshev’s Theorem to calculate the minimum percentage of adults who sleep between: (a) 4.5 and 9.3 hours; (b) 3.9 and 9.9 hours. 6. The national average score for the verbal portion of the College Board’s Scholastic Aptitude Test (SAT) is 507 in 2006. The College Board periodically rescales the test scores so that the standard deviation is kept at 100. Assuming the distribution of the test scores is symmetrical with respect to the mean value, find (a) The maximum percentage of students with an SAT verbal score great than (i) 607, (ii) 690. (b) John took the SAT verbal test in October 2007. In that test the mean score is 499 with standard deviation =120, and his raw score was 660. If the College Board rescaled John’s score back to the 2006 mean and standard deviation, what is John’s score reported to him? What is the minimum percentile ranking for his score according to Chebyshev’s rule? 7. [Multiple choice] A manufacturer claims that its drug test will detect steroid use (that is, show positive for an athlete who uses steroids) 95% of the time. Your friend on the football team has just tested positive. The probability that he uses steroids is: A. 0.95 B. At least 0.95 C. At most 0.95 D. Impossible to determine, based on the information 8. A manufacturer claims that its drug test will detect steroid (a drug to improve performance) use (i.e. show positive for an athlete who uses steroids) 95% of the time. What the company does not tell you is that 10% of all steroid-free individuals also test positive (the false positive rate). Assume 20% of the football team members use steroids. We use the following notation: E = the event that a football team member tests positive, F = the event that a football team member uses steroids, E’ and F’ are the complement of E & F. Construct a table like the following one to analyze the problem and use it to find the probabilities: P(E), P(F), P(E’), P(F’), P(E|F), P(E’|F), P(E|F’), P(E’|F’), P(F|E), P(F|E’), P(F’|E), P(F’|E’), Test + (E) Drug-user (F) Non drug-user Total Test - Total 100 400 500 2


