File
advertisement
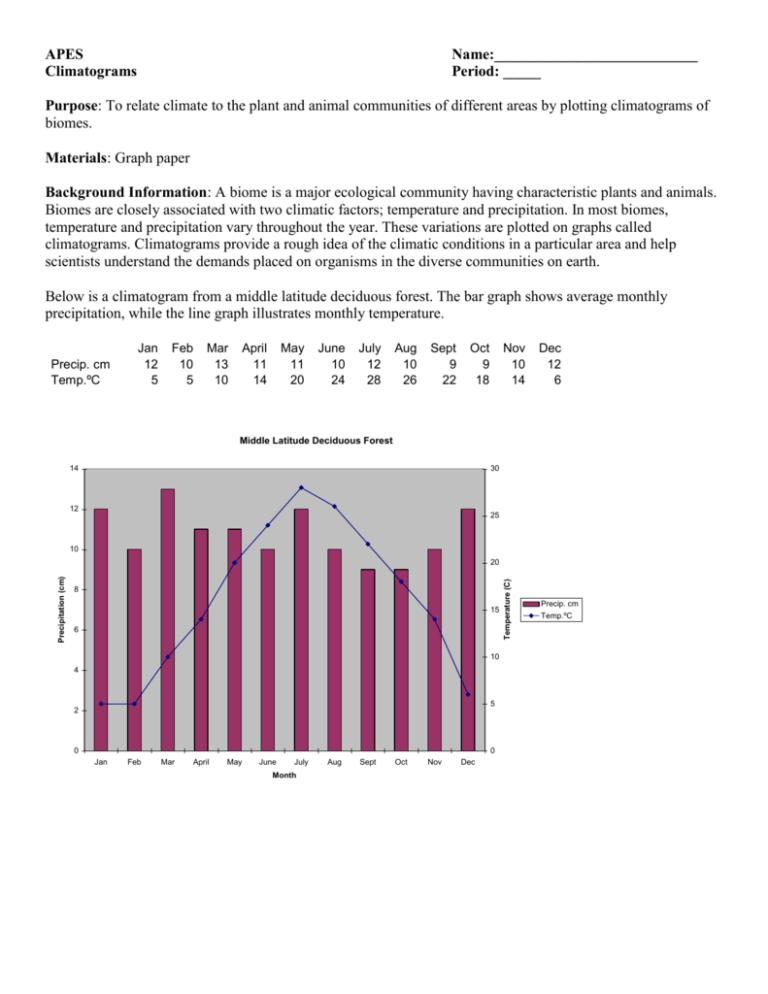
APES Climatograms Name:___________________________ Period: _____ Purpose: To relate climate to the plant and animal communities of different areas by plotting climatograms of biomes. Materials: Graph paper Background Information: A biome is a major ecological community having characteristic plants and animals. Biomes are closely associated with two climatic factors; temperature and precipitation. In most biomes, temperature and precipitation vary throughout the year. These variations are plotted on graphs called climatograms. Climatograms provide a rough idea of the climatic conditions in a particular area and help scientists understand the demands placed on organisms in the diverse communities on earth. Precip. cm Temp.ºC Jan 12 5 Feb 10 5 Mar 13 10 April 11 14 May 11 20 June 10 24 July 12 28 Aug 10 26 Sept 9 22 Oct 9 18 Nov 10 14 Dec 12 6 Temperature (C) Below is a climatogram from a middle latitude deciduous forest. The bar graph shows average monthly precipitation, while the line graph illustrates monthly temperature. Precip. cm Temp.ºC Middle Latitude Deciduous Forest 14 30 12 25 10 Precipitation (cm) 20 8 15 6 10 4 5 2 0 0 Jan Feb Mar April May June July Month Aug Sept Oct Nov Dec Procedure: From the data below, plot a climatogram like the one on the first page for each of the following biomes. Be sure to label each climatogram. 1)Tropical Rainforest (New Guinea) Month Jan Feb Mar April May June July Aug Sept Oct Nov Dec Precip. cm 28 27 33 28 19 21 15 13 13 11 17 27 Temp.ºC 27 26 27 27 27 27 27 27 26 27 27 25 2) Taiga (Anchorage, Alaska) Month Jan Feb Mar April May June July Aug Sept Oct Nov Dec Precip. cm 2 1 1 1 1 3 4 7 7 5 3 2 Temp.ºC -11 -8 -4 0 6 12 14 12 8 2 -6 -10 3) Artic Tundra (Barrow, Alaska) Month Jan Feb Mar April May June July Aug Sept Oct Nov Dec Precip. cm 5 5 5 5 5 1 2 2 2 1 5 5 Temp.ºC -26 -28 -26 -20 -8 0 4 3 -2 -10 -18 -24 4) Grassland (Lawrence, Kansas) Month Jan Feb Mar April May June July Aug Sept Oct Nov Dec Precip. cm 3 3 5 9 13 12 9 11 8 6 5 4 Temp.ºC 0.2 2 6 12 18 24 26 26 22 14 6 0 5)Northern Desert (Reno, Nevada) Month Jan Feb Mar April May June July Aug Sept Oct Nov Dec Precip. cm 3 3 2 1 1 1 0 0 0 1 1 2 Temp.ºC -1 2 6 8 12 16 20 14 14 10 4 0 6) Chaparral (Santa Monica, California) Month Jan Feb Mar April May June July Aug Sept Oct Nov Dec Precip. cm 9 8 7 1 1 0 0 0 0 2 4 6 Temp.ºC 12 12 13 14 16 17 19 13 13 17 14 13 Questions: 1. Which biome has the lowest temperatures throughout the year? 2. Which biome has the most regular rainfall? 3. Which biome has the most irregular rainfall pattern? 4. What similarities are there between the arctic tundra in Barrow, Alaska, and the desert biome in Reno, Nevada? 5. What are the major differences between the grasslands biome and the northern desert biome?
