CHEMISTRY 111
advertisement
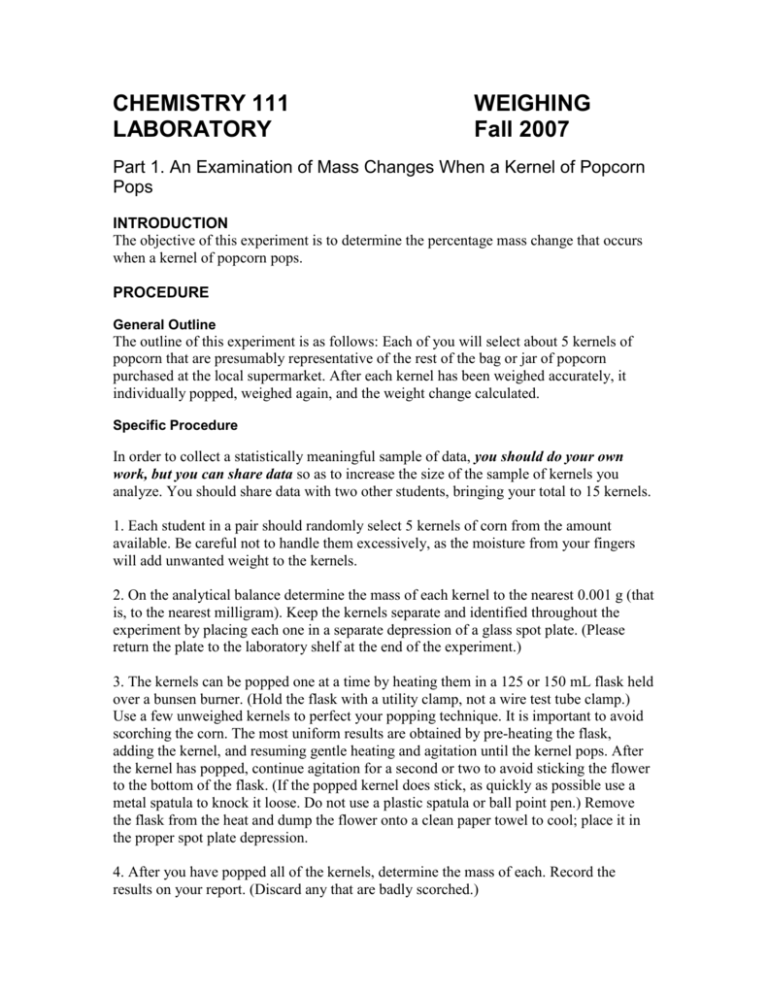
CHEMISTRY 111 LABORATORY WEIGHING Fall 2007 Part 1. An Examination of Mass Changes When a Kernel of Popcorn Pops INTRODUCTION The objective of this experiment is to determine the percentage mass change that occurs when a kernel of popcorn pops. PROCEDURE General Outline The outline of this experiment is as follows: Each of you will select about 5 kernels of popcorn that are presumably representative of the rest of the bag or jar of popcorn purchased at the local supermarket. After each kernel has been weighed accurately, it individually popped, weighed again, and the weight change calculated. Specific Procedure In order to collect a statistically meaningful sample of data, you should do your own work, but you can share data so as to increase the size of the sample of kernels you analyze. You should share data with two other students, bringing your total to 15 kernels. 1. Each student in a pair should randomly select 5 kernels of corn from the amount available. Be careful not to handle them excessively, as the moisture from your fingers will add unwanted weight to the kernels. 2. On the analytical balance determine the mass of each kernel to the nearest 0.001 g (that is, to the nearest milligram). Keep the kernels separate and identified throughout the experiment by placing each one in a separate depression of a glass spot plate. (Please return the plate to the laboratory shelf at the end of the experiment.) 3. The kernels can be popped one at a time by heating them in a 125 or 150 mL flask held over a bunsen burner. (Hold the flask with a utility clamp, not a wire test tube clamp.) Use a few unweighed kernels to perfect your popping technique. It is important to avoid scorching the corn. The most uniform results are obtained by pre-heating the flask, adding the kernel, and resuming gentle heating and agitation until the kernel pops. After the kernel has popped, continue agitation for a second or two to avoid sticking the flower to the bottom of the flask. (If the popped kernel does stick, as quickly as possible use a metal spatula to knock it loose. Do not use a plastic spatula or ball point pen.) Remove the flask from the heat and dump the flower onto a clean paper towel to cool; place it in the proper spot plate depression. 4. After you have popped all of the kernels, determine the mass of each. Record the results on your report. (Discard any that are badly scorched.) 5. Share your data with two other students in the laboratory section. Be sure to write their names on the report form. Part 2. An Examination of How Weight Changes in Pennies as they Age The objective of this experiment is to examine the masses of pennies of different ages. To do this, you will weigh a sample of pennies of different ages and see if they gain or lose mass with time. Pennies might become heavier as they age through an oxidation process. Or, they might become lighter as the surface of the penny wears away from use. Or something else might happen. That’s why we do the experiment. Your data should be presented graphically with a plot of mass vs. year of issue. The use of Excel for plotting will be taught during the recitation section. Each student should select 5 pennies to weigh, ranging in date of issue from current back to at least the 1960’s. As in the case of the popcorn experiment, in order to collect a statistically meaningful sample of data, you should do your own work, but you must share data so as to increase the size of the sample of pennies you analyze. Your plot should contain data for at least 30 pennies. Once you have your plot, you need to explain it. Part 3. Composition of Nickels Nickels are actually made of an alloy containing nickel and copper. The dimensions of a nickel coin are: diameter: 21.21 mm thickness: 1.95 mm Using this information, the density of nickel and copper, and the mass of a nickel (which you need to weigh), calculate the percent composition of nickel and of copper in a nickel coin. You can weigh just one coin in this portion of the experiment. Part 4. Determining the Average Diameter of Lead “Shot” Lead shot is lead metal in the form of little spheres. Weigh a sample of lead shot. Record the mass and the number of little spheres. Use this information and the density of lead to calculate the average diameter of the little spheres. Weighing, and things you can figure out from it. Report Guide. What you Hand In Part 1. For the popcorn experiment, you should prepare a brief report showing your raw data and any calculations you use to determine the percent mass change upon popping. Your report should include a table like that at the end of this handout and the average mass change. Answer the following questions: a. Is mass gained or lost? b. Propose a reason for the mass loss. c. Propose an explanation for what actually happens when popcorn pops. Part 2. For the penny experiment, you should prepare the plot of mass vs. year of issue and a written statement explaining what you find. You should comment on whether pennies seem to change mass as the age and explain any other features of your plot. Part 3. Use your data for the mass of a nickel coin to calculate the percent nickel and copper in the coin. Show your calculations. You will need to use an algebraic substitution when doing this. Hint: The total mass = mass Ni + mass Cu Total volume = volume Ni + volume Cu volume Ni = mass Ni x density Ni volume Cu = mass Cu x density Cu Part 4. Use your data to determine the average diameter of lead shot. First determine the average mass per sphere. This and the density of lead will give the average volume, and then the average diameter. POPCORN DATA NAME: ____________________ Student Partners: __________________________________________ Kernel # Student initials Initial Mass Final Mass Mass Change % Change
