Unit 2
Academic Physics
Name___________________
Distance v. Time Graphs
v
Rise d d 2 d1
Run t
t 2 t1
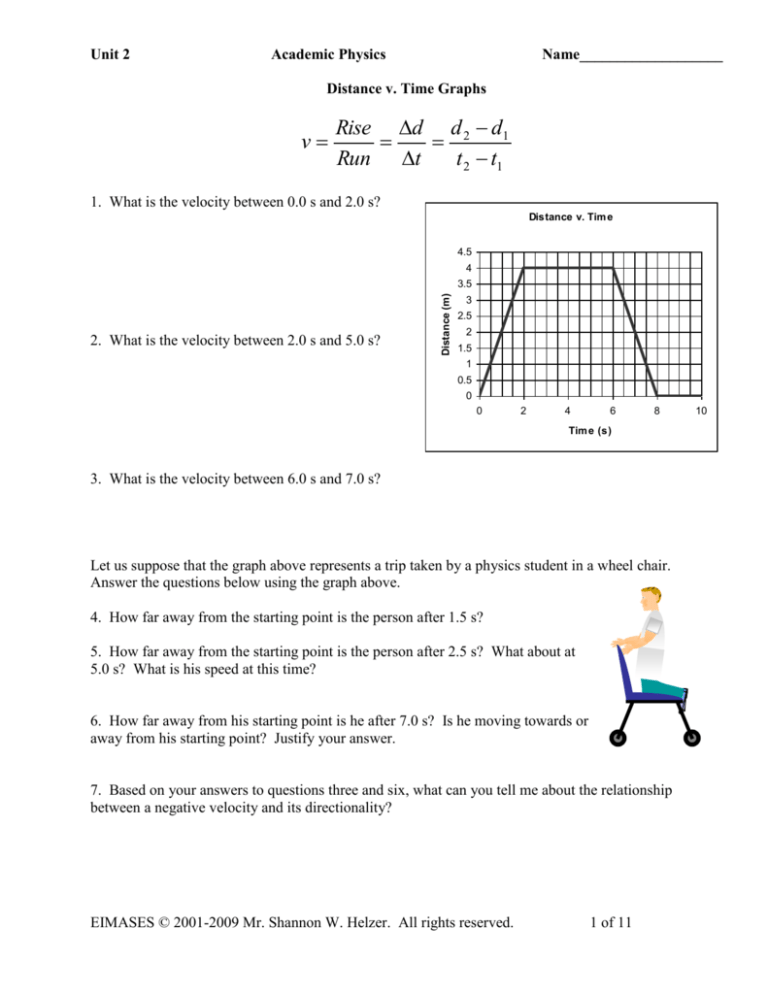
1. What is the velocity between 0.0 s and 2.0 s?
Distance v. Tim e
4.5
4
2. What is the velocity between 2.0 s and 5.0 s?
Distance (m)
3.5
3
2.5
2
1.5
1
0.5
0
0
2
4
6
8
Tim e (s)
3. What is the velocity between 6.0 s and 7.0 s?
Let us suppose that the graph above represents a trip taken by a physics student in a wheel chair.
Answer the questions below using the graph above.
4. How far away from the starting point is the person after 1.5 s?
5. How far away from the starting point is the person after 2.5 s? What about at
5.0 s? What is his speed at this time?
6. How far away from his starting point is he after 7.0 s? Is he moving towards or
away from his starting point? Justify your answer.
7. Based on your answers to questions three and six, what can you tell me about the relationship
between a negative velocity and its directionality?
EIMASES © 2001-2009 Mr. Shannon W. Helzer. All rights reserved.
1 of 11
10
Distance v. Tim e
450
400
Distance (km)
350
Stewart little ventures out from the safety of the
Little residence and takes a very long trip. His trip
is graphed in the graph to the right. Answer the
questions below based on the graph of Stewart’s
trip.
300
250
200
150
100
50
8. What is Stewart’s velocity between 5.0 hours and
9.0 hours?
0
0
20
40
Tim e (hours)
9. How far away from his starting point is he after 15 hours?
10. What is Stewart doing between 20.0 and 25.0 hours into his trip? Explain your answer.
11. What is his velocity at 30.0 hours into his trip?
12. Is this a round trip back to the Little’s house? Why or why not?
EIMASES © 2001-2009 Mr. Shannon W. Helzer. All rights reserved.
2 of 11
Velocity v. Time Graphs
a
Rise v v2 v1
Run t t 2 t1
13. What is the acceleration between 0.0 s and 2.0 s?
Velocity v. Time
14. What is the acceleration between 2.0 s and 5.0
s?
Velocity (m/s)
5
4
3
2
1
0
0
4
8
12
Time (s)
15. What is the acceleration between 6.0 s and 7.0 s?
Let us suppose that the graph above represents a trip taken by a physics student in a wheel chair.
Answer the questions below using the graph above.
16. How fast is he going after 1.5 s?
17. How fast is he going after 2.5 s? What about after 5.0 s? What is his
acceleration at this time?
18. Consider his original starting position after 7.0 s? Is he moving towards or
away from his starting point? Justify your answer.
19. Based on your answers to questions 15 and 18, what can you tell me about the relationship between
a negative acceleration and its velocity?
EIMASES © 2001-2009 Mr. Shannon W. Helzer. All rights reserved.
3 of 11
Stewart little ventures out from the safety of the
Little residence and takes a very long trip. His trip
is graphed in the graph to the right. Answer the
questions below based on the graph of Stewart’s
trip.
20. What is Stewart’s velocity 15 min into his trip?
What is his acceleration?
Velocity (km/hr)
Velocity v. Time
13
12
11
10
9
8
7
6
5
4
3
2
1
0
0
1
2
3
Time (hr)
21. What is his speed at 1.5 hours into his trip?
22. Is Stewart speeding up or slowing down 1 hr and 39 min into his trip? Explain your answer.
23. What is his velocity at 3.0 hours into his trip?
EIMASES © 2001-2009 Mr. Shannon W. Helzer. All rights reserved.
4 of 11
Distance v. Time & Acceleration v. Time Graphs
Answer the questions below based upon the Displacement v. Time graph and the Velocity v. Time graph
given below. These graphs are completely unrelated to each other.
Displacement v. Time
24. What was the average velocity for the period
between 10 and 15 minutes of the trip depicted by the
30
Displacement v. Time graph?
Distance v. Time
25. What is the velocity of the car at 29 minutes into the
trip?
Displacement (km)
25
20
15
10
5
0
0
10
20
30
40
15
20
Time (min)
26. Where is the person at the end of his/her trip relative to where he/she began?
Velocity v. Time
27. Indicate by circling whether the acceleration is a = 0,
a > 0, or a < 0 in the time periods below.
Velocity v. Time
5
4
a=0
a<0
a>0
b. t = 12 seconds:
a=0
a<0
a>0
c. t = 15 seconds:
a=0
a<0
a>0
d. t = 6 seconds:
a=0
a<0
a>0
3
Velocity (m/s)
a. t = 0 to 2 seconds:
2
1
0
-1
0
5
10
-2
28. What is the acceleration between 5 seconds and 7
seconds?
-3
EIMASES © 2001-2009 Mr. Shannon W. Helzer. All rights reserved.
Time (s)
5 of 11
Kerri and Ashley start from Kerri’s house and go for a little trip to run
some errands. After they are done with the errands, they want to watch
a movie at Ashley’s house. Their distance from Kerri’s house for this
trip is plotted as a function of time below. Use this Distance v. Time
graph in order to answer the questions below.
29. Indicate by circling whether the velocity is v = 0, v >
0, or v < 0 in the time periods below.
v=0 v<0 v>0
b. t = 7 hours:
v=0 v<0 v>0
c. t = 9 hours:
v=0 v<0 v>0
d. t = 12 hours:
v=0 v<0 v>0
5
4
3
Distance (km)
a. t = 0 to 2 hours:
Distance v. Tim e
2
1
0
-1
0
2
4
6
8
10
12
14
16
18
20
-2
-3
Tim e (hours)
30. How far from the Kerri’s house are they after 4.0 hours?
31. How many times did they pass Kerri’s house before they ended their trip? Explain your answer and
give the approximate times when they passed the house.
32. At 11 hours into their trip, were they going towards or away from Kerri’s house? What about at 14
hours?
EIMASES © 2001-2009 Mr. Shannon W. Helzer. All rights reserved.
6 of 11
Position vs. Time Graphs Worksheet #2a (Instantaneous Velocity and Tangents)
Slope of D vs. t = v
rise d d 2 d1
run t
t 2 t1
Instructions: An RC car accelerates across a straight track. Its position from the starting point is plotted
on the graph with respect to time. Use the graph to fill in the table relating time to the position of the
car.
Position (m)
Position vs. Time
50
Position/Distance (m)
Time (s)
0.0
1.0
2.0
3.0
4.0
5.0
6.0
7.0
40
30
20
10
0
0
1
2
3
4
5
6
7
Time (s)
Instructions: Answer questions clearly. Circle answers to calculation questions.
33. What do you notice about the distance being covered as each second passes?
____________________________________________________________________________________
34. How may your answer to question #1 affect your understanding of what is happening to the velocity
as each second passes?
____________________________________________________________________________________
35. What is the displacement of the RC car between 0.0s and 2.0s ?
36. What is the average velocity of the car during the 0.0s to 2.0s time interval?
37. What is the displacement of the RC car between 2.0s and 5.0s ?
38. What is the average velocity of the car during the 2.0s to 5.0s time interval?
39. How do your answers to questions 35 and 36 reinforce your notions in questions 33 & 34?
____________________________________________________________________________________
EIMASES © 2001-2009 Mr. Shannon W. Helzer. All rights reserved.
7 of 11
40. What is the average velocity for the entire interval from 0.0s to 7.0s ?
41. How does your calculation in problem 40 compare with your previous calculations of velocity?
____________________________________________________________________________________
0.0s
3.0s
6.0s
Position vs. Time
50
Position/Distance (m)
Instructions: An identical (but
larger) chart is shown below. Plot a
tangent line at each of the following
points:
40
30
20
10
0
0
1
2
3
4
5
6
7
Time (s)
42. What do you notice about the slopes of each of these tangents as time is increased?
____________________________________________________________________________________
Calculate the instantaneous velocity for each of the selected points in problems #43-45 using the
tangents you just drew.
43. Instantaneous Velocity at 0.0s
44. Instantaneous Velocity at 3.0s
45. Instantaneous Velocity at 6.0s
46. How do the instantaneous velocities calculated compare with the slopes mentioned in problem 42?
____________________________________________________________________________________
____________________________________________________________________________________
EIMASES © 2001-2009 Mr. Shannon W. Helzer. All rights reserved.
8 of 11
Slope of D vs. t = v
rise d d 2 d1
run t
t 2 t1
Instructions: The RC car from a previous worksheet is driven off of a 313.6m high cliff by an
irresponsible RC enthusiast! The position vs. time graph of the car plummeting to its doom in 8.0s is
shown below. Answer the questions completely and circle numbered answers. (Note: The graph relates
vertical position to time)
Position vs. Time
350
Position (m)
300
250
200
150
100
50
0
0
1
2
3
4
5
6
7
8
Time (s)
47. Where has the reference point been placed in this situation? ___________________
48. Why may it be a good idea to arrange it this way?
____________________________________________________________________________________
49. On the graph above, plot tangent lines at 0.0s , 4.0s , and 7.0s
50. What is the average velocity of the car throughout the fall ( 0.0s to 8.0s )?
51. In what direction is the car moving vertically? How do you know from your calculations in
problem 49?
____________________________________________________________________________________
EIMASES © 2001-2009 Mr. Shannon W. Helzer. All rights reserved.
9 of 11
52. Calculate the instantaneous velocities of the car for the times mentioned in problem 49.
a. 0.0s
b. 4.0s
c. 7.0s
53. Based on the trends of this problem, at what moment in time would you deduce that the car is
falling the fastest? Why?
____________________________________________________________________________________
____________________________________________________________________________________
54. For a given time interval, how does the instantaneous velocity of an object on a graph differ from its
average velocity on a graph?
____________________________________________________________________________________
____________________________________________________________________________________
____________________________________________________________________________________
____________________________________________________________________________________
EIMASES © 2001-2009 Mr. Shannon W. Helzer. All rights reserved.
10 of 11
*** Giancoli Physics Homework Assignment ***
Read Chapter 2 Sections 1-4, and 8
Answer Conceptual Questions (Page 38) 1, 2, 19 – 22.
Do Problems (Page 39) 1, 6, 16, 49, 51, and 56 (Make sketches of your graphs in your composition
notebook)
Chapter Vocabulary
1. Mechanics –
2. Kinematics –
3. Dynamics –
4. Translational Motion –
5. Is Displacement a Vector? Why or why not?
6. Is Speed a Vector? Why or why not?
7. Is Velocity a Vector? Why or why not?
8. Slope –
EIMASES © 2001-2009 Mr. Shannon W. Helzer. All rights reserved.
11 of 11


