Demand and Supply
advertisement
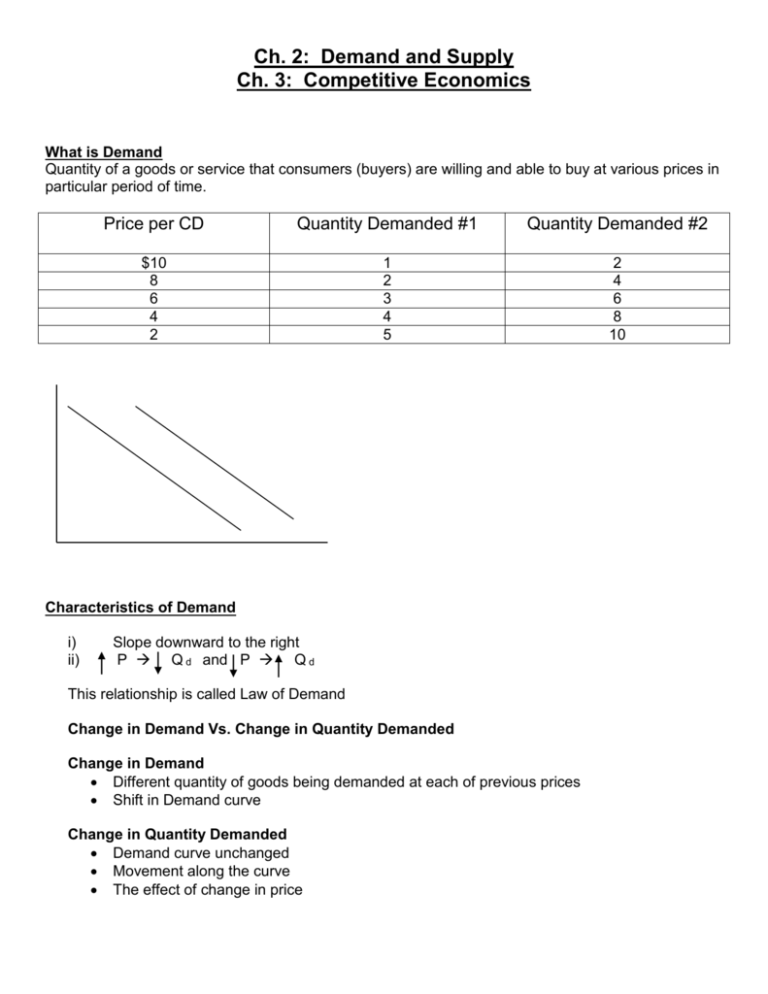
Ch. 2: Demand and Supply Ch. 3: Competitive Economics What is Demand Quantity of a goods or service that consumers (buyers) are willing and able to buy at various prices in particular period of time. Price per CD Quantity Demanded #1 Quantity Demanded #2 $10 8 6 4 2 1 2 3 4 5 2 4 6 8 10 Characteristics of Demand i) ii) Slope downward to the right P Q d and P Q d This relationship is called Law of Demand Change in Demand Vs. Change in Quantity Demanded Change in Demand Different quantity of goods being demanded at each of previous prices Shift in Demand curve Change in Quantity Demanded Demand curve unchanged Movement along the curve The effect of change in price -2Changes in Demand 1. Number of buyers more buyers = more demand & fewer buyers = less demand 2. Income effect for normal products increased income = increased demand, BUT for inferior products (e.g. Kraft dinner) increased income = decreased demand 3. Prices of Substitute Products margarine and butter 4. Prices of Complementary Products cars and gasoline 5. Consumer Preferences DVDs more popular than video tapes 6. Consumer Expectations expect price to change in the future (e.g. gas price increases in the future so buy now) Utility Maximization Measurement in utils of human satisfaction when consuming products Consume up to and including the point where your satisfaction level is equal between two products MU / P1 = MU / P2 Law of Diminishing Marginal Utility satisfaction diminishes with increased consumption therefore must decrease price to increase consumption The Nature of Supply What is supply Refers to “the relationship between the various possible prices of a product and the quantities of the product that businesses are willing to put on the market” Supply Schedule for final exams in economics class Price per exam $10 000 $ 8 000 $ 6 000 $ 4000 $ 3000 Quantity teacher is willing to sell 5 4 3 2 1 -3Characteristics of Supply i) upward sloping to the right ii) PQs iii) P Qs This direct relationship between price and the quantity supplied (ceteris paribus) is called the law of supply Changes in supply a change (increase or decrease) in the quantity supplied of a commodity at each price in the supply schedule Causes (Supply Determinants) i) number of producers-increase in producers leads to increase in supply (shift to right) ii) resource prices (cost of production) – higher costs less supply iii) state of technology – increased efficiency leads to increased supply iv) changes in nature (e.g. drought, flood, earthquake, early frost) v) prices of related products Change in Supply vs. Change in Quantity Supplied change in supply illustrated by movement of the curve to left or right caused by change in supply determinant change in quantity supplied illustrated by movement on the curve the effect of a change in price Elasticity sensitivity of quantity demanded and supplied to price 1. Elastic Demand / Supply price increase met by a larger corresponding increase in quantity demanded / supplied (e.g. good with many substitutes like Big Mac for demand / plastic toys with molds already existing for supply) ∆Q ÷ Avg. Q > 1 Dd P ↑ TR ↓ ∆P ÷ Avg. P 2. Inelastic Demand / Supply price increase met by a less than corresponding increase in quantity demanded / supplied (e.g. essential good like medicine or cheap product like salt for demand / limited amount of goods such as agriculture for supply) ∆Q ÷ Avg. Q = 0 - 1 Dd P ↑ TR ↑ ∆P ÷ Avg. P 3. Unit Elastic Demand / Supply price increase met by a corresponding increase in quantity demanded / supplied (e.g. cars for demand / oil for supply) ∆Q ÷ Avg. Q = 1 Dd P ↑ TR ∆ P ÷ Avg. P -4INTERACTION OF SUPPLY AND DEMAND Equilibrium Price - a price determined in the marketplace by the interaction of supply and demand Equilibrium Quantity - the quantity sold (bought) at the equilibrium price At the point of equilibrium: Qs = QD therefore no excess demand or supply therefore price is stable with no pressure to increase or decrease -5Excess Supply (Price Floor) Qs QD, therefore sellers have to lower price to sell surplus products -lower price will cause consumers to increase the quantity they demand of the product and sellers to decrease the quantity they supply. -in a situation of excess supply there will be pressure on price to drop which will cause quantity demanded to increase and quantity supplied to decrease until they equal one another (i.e. equilibrium) Excess Demand (Price Ceiling) QD Qs -therefore sellers can raise price to exploit shortage of product -higher price will cause consumers to decrease the quantity they demand of the product and sellers to increase the quantity they sell -in a situation of excess demand there will be pressure on the price to rise which will cause quantity demanded to decrease until they equal one another (i.e. equilibrium) Product: Final Exams Market: Economics Class P- Price in thousands of dollars Qs-Quantity Supplied of final exams QD-Quantity demanded of final exams P 10 8 6 4 2 Qs 10 8 6 4 2 QD 2 4 6 8 10 -6- 1. Plot the following on a graph 2. Show the equilibrium price and quantity 3. What is the situation when the teacher charges $8000 4. What is the situation when the teacher charges $4000 Changes in Supply and Demand In competitive markets supply and demand interact freely to determine the equilibrium price and quantity, which will change as supply or demand change. Product: Final Exams P Qs QD $10 8 6 4 2 10 8 6 4 2 2 4 6 8 10 Market: Gr. 12 Economics Class P – Price of thousands of dollars Qs – Quantity Supplied of final exams QD - Quantity Demanded for final exams In equilibrium P= $ 6000.00 1. What would the equilibrium price and quantity be if the teacher supplies two less exams at each of the previous prices? Show this on a market schedule and graphical illustration. -7- P Qs0 Qs1 QD $10 8 6 4 2 10 8 6 4 2 8 6 4 2 0 2 4 6 8 10 2. Assuming equilibrium price is $6000 and quantity is 6 final exams what would occur if the students in the teacher’s class demand two more exams at each of the previous prices. Show this on a market schedule and graphical illustration. P Qs QD0 QD1 $10 8 6 4 2 10 8 6 4 2 2 4 6 8 10

