Chemistry Laboratory
advertisement
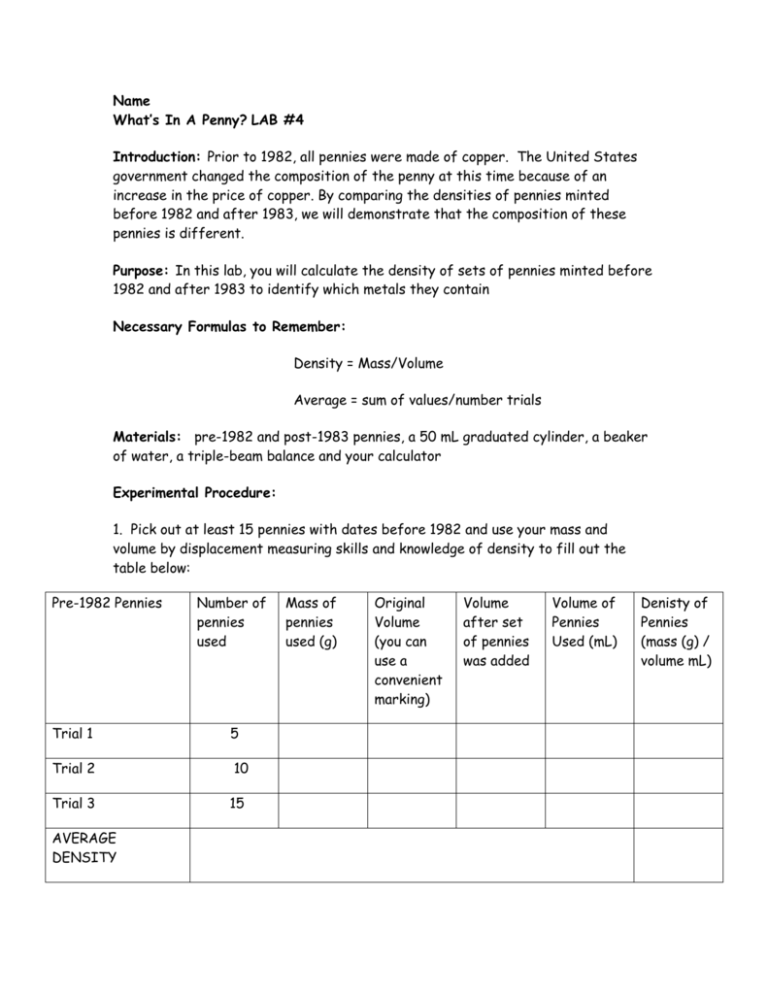
Name What’s In A Penny? LAB #4 Introduction: Prior to 1982, all pennies were made of copper. The United States government changed the composition of the penny at this time because of an increase in the price of copper. By comparing the densities of pennies minted before 1982 and after 1983, we will demonstrate that the composition of these pennies is different. Purpose: In this lab, you will calculate the density of sets of pennies minted before 1982 and after 1983 to identify which metals they contain Necessary Formulas to Remember: Density = Mass/Volume Average = sum of values/number trials Materials: pre-1982 and post-1983 pennies, a 50 mL graduated cylinder, a beaker of water, a triple-beam balance and your calculator Experimental Procedure: 1. Pick out at least 15 pennies with dates before 1982 and use your mass and volume by displacement measuring skills and knowledge of density to fill out the table below: Pre-1982 Pennies Number of pennies used Trial 1 5 Trial 2 10 Trial 3 AVERAGE DENSITY 15 Mass of pennies used (g) Original Volume (you can use a convenient marking) Volume after set of pennies was added Volume of Pennies Used (mL) Denisty of Pennies (mass (g) / volume mL) Part 2: Pick out at least 15 pennies with dates after 1983 and use your mass and volume by displacement measuring skills and knowledge of density to fill out the table below: Post-1983 Pennies Number of pennies used Trial 1 5 Trial 2 10 Trial 3 15 Mass of pennies used (g) Original Volume (you can use a convenient marking) Volume after set of pennies was added Volume of Pennies Used (mL) Average Density Conclusion Questions: 1. Should the volume of increasing numbers of pennies used in the trials (circle the correct answer) a) increase b) decrease or c) remain the same In at least 1 complete sentence, explain your logic: 2) Should the mass of increasing numbers of pennies used in trials (circle the correct answer) a) increase b) decrease or c) remain the same In at least 1 complete sentence, explain your logic: 3) Should the density of increasing numbers of pennies used in trials (circle the correct answer) a) increase b) decrease or c) remain the same In at least 1 complete sentence, explain your logic: Denisty of Pennies (mass (g) / volume mL) 4) Examine your data carefully in order to answer the following questions: a) For pre-1982 pennies, were your calculated densities for trials 1-3 similar?_____ b) For post-1983 set pennies, were your calculated densities similar?_____ c) Which of the sets of pennies had a higher density?_____ Have your group reader read the introduction one more time to inform your discussions about the following questions! 5) Explain why the two sets of pennies should have difference densities 6) Assuming that pennies minted before and after 1982/1983 are the same volume, explain which set should be heavier and why? Compare your calculated densities to the densities of the following metals: Symbol Element/Metal Density in g/mL Ni Al Fe Zn Cu Hg Pb Nickel Aluminum Iron Zinc Copper Mercury Lead 8.9 2.7 7.9 7.1 9.0 13.5 11.5 7) Which metal(s) best match your calculated post-1983 density? 8) EXTRA CREDIT!!!!: Find and record the latest market prices of nickel, aluminum, copper, zinc, iron, silver and gold (be careful that you are comparing prices with the same units). Explain in at least 2 full sentences why our coins’ composition changes depending on the global metal market: Name: Lab #5, Graphing, What’s in a Penny? Introduction: Graphs are used to visually illustrate data. You will be graphing your 3 data points for the pre-1982 and post-1983 penny sets, placing volume on the xaxis and mass on the y-axis Drawing a best-fit line between graphed points is a graphical way in which to average data. The slope of a best-fit line is equal to the rise divided by the run, as illustrated in the following formula: Slope = rise run =∆y ∆x = y2 –y1 = x2-x1 In this lab your slope should equal your average difference in mass, divided by your average difference in volume, or the density of the set of pennies! Purpose: In this lab, we are going to graph the data you collected in Lab #4 and calculate the slope of the lines illustrating each set of pennies to check your average density calculations. Materials: graph paper, pencil, Lab #4, ruler Procedure (ALL GROUP MEMBERS MUST COMPLETE EACH STEP BEFORE GOING ONTO THE NEXT!): 1. Draw and label your x and y axis 2. Determine the scale/units to use (the trick is to count the number of lines on your graph paper and divide it by the range of your data) 3. Mark the lines/units on the axis 4. Locate/identify the data for the pre-1982 pennies on Lab #4 and plot them with 3 dots 5. Locate/identify the data for the post-1983 pennies on Lab #4 and plot them with 3 stars 6. Using your ruler, draw the line that best intersects/divides data points and crosses the (0,0) for the pre-1982 data set 7. Using your ruler, draw the line that best intersects/divides data points and crosses the (0,0) for the pre-1982 data set 8. Mark two points ON your pre-1982 line and write their x and y values beside them (format (x,y) 9. Mark two points ON your post-1983 line and write their x and y values beside them 10. Use the space below to calculate your slope: Pre-1982 Pennies Slope = rise run =∆y ∆x = y2 –y1 = x2-x1 – - =∆y ∆x = y2 –y1 = x2-x1 – - _ = Post-1983 Pennies Slope = rise run _ = Conclusion Questions: 1. Compare the slopes that you just calculated to your average density values for each set of pennies. Explain why these values could be different. 2. Explain some of the benefits you discovered to graphing data:
