AP® Statistics
advertisement
AP® Statistics
Overview of AP® Statistics
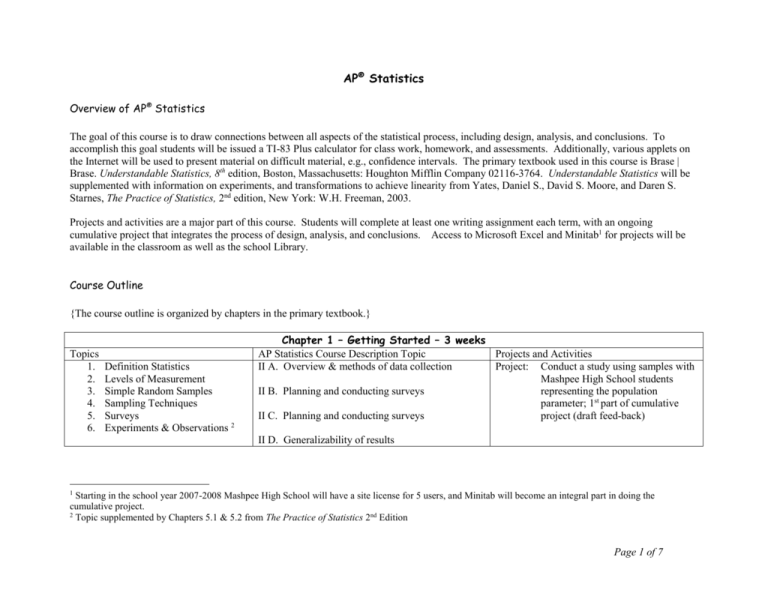
The goal of this course is to draw connections between all aspects of the statistical process, including design, analysis, and conclusions. To
accomplish this goal students will be issued a TI-83 Plus calculator for class work, homework, and assessments. Additionally, various applets on
the Internet will be used to present material on difficult material, e.g., confidence intervals. The primary textbook used in this course is Brase |
Brase. Understandable Statistics, 8th edition, Boston, Massachusetts: Houghton Mifflin Company 02116-3764. Understandable Statistics will be
supplemented with information on experiments, and transformations to achieve linearity from Yates, Daniel S., David S. Moore, and Daren S.
Starnes, The Practice of Statistics, 2nd edition, New York: W.H. Freeman, 2003.
Projects and activities are a major part of this course. Students will complete at least one writing assignment each term, with an ongoing
cumulative project that integrates the process of design, analysis, and conclusions. Access to Microsoft Excel and Minitab1 for projects will be
available in the classroom as well as the school Library.
Course Outline
{The course outline is organized by chapters in the primary textbook.}
Topics
1.
2.
3.
4.
5.
6.
Definition Statistics
Levels of Measurement
Simple Random Samples
Sampling Techniques
Surveys
Experiments & Observations 2
Chapter 1 – Getting Started – 3 weeks
AP Statistics Course Description Topic
Projects and Activities
II A. Overview & methods of data collection
Project: Conduct a study using samples with
Mashpee High School students
II B. Planning and conducting surveys
representing the population
parameter; 1st part of cumulative
II C. Planning and conducting surveys
project (draft feed-back)
II D. Generalizability of results
1
Starting in the school year 2007-2008 Mashpee High School will have a site license for 5 users, and Minitab will become an integral part in doing the
cumulative project.
2
Topic supplemented by Chapters 5.1 & 5.2 from The Practice of Statistics 2nd Edition
Page 1 of 7
Chapter 2 – Organizing Data – 1 ½ weeks
Topics
1.
2.
3.
4.
5.
6.
7.
Bar Graphs
Circle Graphs
Time-Series Graphs
Frequency Distributions
Histograms
Dotplots
Distribution Shapes
AP Statistics Course Description Topic
Project and Activities
I. A
Constructing & interpreting graphical
displays of distributions of univariate data
I. B
Summarizing distributions of univariate data
Activity: Graphical Displays from USA
Today – What makes for a good
display?
Activity: Using the TI-83 graphing calculator
I. C
Comparing distributions of univariate data
(dotplots, back-to-back stemplots, paralle1
boxplots)
Chapter 3 – Averages and Variation – 2 weeks
8. Measures of Central Tendency
(Mean, Median, Mode)
9. Measures of Variation (Standard
Deviation, Variation, Range)
10. Mean & Standard Deviation of
Grouped Data
11. Percentiles & Box-and-Whisker
Plots
I. E
Exploring categorical data
Activity: Measure height versus arm spread
(Note: parts IA, IB, and IC are also covered
in this chapter)
Project: (continuation) graphical display,
shape, outliers, spread, and measures
of central tendency (draft feedback)
Activity: Using Minitab & Excel
Activity: Using the TI-83 graphing calculator
Chapter 10.1 – 10.2 – Correlation and Regression – 2 weeks
12.
13.
14.
15.
16.
17.
3
4
Scatter Diagrams
Linear Correlation
Linear Regression
Coefficient of Determination
Residual Plots3
Transformations4
I. D Exploring bivariate data
Project (continuation) for bivariate data linear
regression models developed and
analyzed (draft feedback)
Activity: Using Minitab & TI-83
Time is spent on Problem 17 for residual plots & is supplements by information is Chapter 3.3 of Yates, Moore, and Starnes
Lesson is prepared based on information from Chapter 3.4 of Yates, Moore, and Starnes
Page 2 of 7
Chapter 4 – Elementary Probability Theory – 2 weeks
Topics
1. Probability
2. Law of large numbers
3. Compound events –
multiplication and additive rules
4. Independence & dependence
5. Trees and counting techniques –
includes permutations,
combinations
AP Statistics Course Description Topic
Project and Activities
III. A. Probability
Linking Concepts: Writing Projects at the end
of Chapter 3. Problem 2. Why do we need to
study the variation of a collection of data? Why
isn’t the average by itself adequate? Etc.
III. B. Combining independent random variables
Chapter 5 – The Binomial Probability Distribution and Related Topics – 2 weeks
1. Random Variables and
Probability Distributions
2. Binomial Probabilities
3. Additional Properties of the
Binomial Distribution
4. The Geometric and Poisson
Probability Distributions
III. A. Probability
Linking Concepts: Writing Projects at the end
of Chapter 4. Problem 2. Discuss the concepts
III. B. Combining independent random variables
of mutually exclusive events and independent
events. List several examples of each type of event
from everyday life. Etc.
Activity: Using Minitab & TI-83
Chapter 6 – Normal Distributions – 3 weeks
1. Graphs of Normal Probability
III. C. The normal distribution
Distributions
2. Standard Units and Areas Under
the Standard Normal Distribution
3. Areas Under Any Normal Curve
4. Normal Approximation to the
Binomial Distribution
Read and synopsize paper: “Is it Normal?”
Website (reference)
http://apcentral.collegeboard.com/apc/members/courses/
teachers_corners/37042.html.
Activity: Using TI-83
Page 3 of 7
Chapter 7 – Introduction to Sampling Distributions – 3½ weeks
Topics
1. Sampling Distributions
2. The Central Limit Theorem
3. Sampling Distributions for
Proportions
AP Statistics Course Description Topic
Project and Activities
III. D. Sampling Distributions
Linking Concepts: Writing Projects at the end
of Chapter 7. Problem 2. In a way, the central
limit theorem can be thought of as a kind of “grand
central station.” … List and discuss at least three
variables from everyday life for which you expect
the variable x itself does not follow a normal or bell
shaped distribution. Etc.
Chapter 8 – Estimation – 3½ weeks
1. Estimating µ when σ is known
2. Estimating µ when σ is unknown
3. Estimating p in the Binomial
Distribution
4. Estimating μ1 – μ2
5. Estimating p1 – p2
III. D. (sampling distribution 5-distribiton)
Read and synopsize paper: “Is That an
Assumption or a Condition?” Website:
IV. A. Estimation
http://apcentral.collegeboard.com/apc/members/courses/
teachers_corners/31609.html.
Activity: Applet from Internet on confidence
interval
Project: (continuation) – Point estimate from
the sample data collected.
Chapter 9 – Hypothesis Testing - 4½ weeks
1.
2.
3.
4.
Introduction to Statistical Tests
Testing the Mean μ
Testing a Proportion p
Testing Involving Paired
Differences (Dependent
Samples)
5. Testing μ1 – μ2 (Independent
Samples)
6. Testing p1 – p2 (Independent
Samples)
IV. B. Tests of Significance
Linking Concepts: Writing Projects at the end
of Chapter 9. The most important questions in
life usually cannot be answered with absolute
certainty. Many important questions … etc.
Page 4 of 7
Chapter 10.3 – Inferences for correlation & regression - ½ weeks
Topics
1. Inferences for Correlation and
Regression
AP Statistics Course Description Topic
Project and Activities
IV. B. Tests of Significance
Activity: Using Minitab
Chapter 11 – Chi-Square and F Distributions {Covers only Chi-Square}– 2 weeks
1. Chi-Square; Tests of
Independence
2. Chi-Square; Goodness of Fit
3. Testing and Estimating a Single
Variance or Standard Deviation
IV. B. Tests of Significance
Project: (continuation) – Perform a test of
significance at the .05 level on the
data collected (draft feed-back).
AP Examination Review – 2 weeks
1. All Questions from AP Exam
2006
2. All Questions from AP Exam
2005
3. All Open Response Questions
from 2002 through 2004
Post AP Examination -2 weeks
1. Finalize Project (cumulative) –
draw conclusions and submit
(Minitab output required)5
Students will present their
reports to the class.
5
The course draws connections between all aspects of
the statistical process, including design, analysis and
conclusions.
Field Trip – Coca-Cola Plant (control charts,
quality control, etc.)
See the attached for a description of this cumulative project
Page 5 of 7
Cumulative Project Description - AP® Statistics6
Data Collection:
Through observation collect a sample of quantitative data from a population. The data must be bivariate and the
student must obtain at least 50 values. Students must submit a paper describing the data they intend to collect
and state how they plan to collect the data. {This insures the student understands what constitutes a population,
simple random sample, bias, etc.} Students should get teacher approval before conducting the survey or
experiment.
Exploring & Analyzing Data: (Part I):
Using appropriate displays discuss the data collected in the “Data Collection” part of the project focusing on the
shape of the data, outliers, measures of central tendency, and measures of dispersion. Note, the data collected is
bivariate; however, the data can be viewed from two aspects – one set of data for the explanatory variable, the
other set of data for the response variable. Students must submit a draft to the teacher for feedback.
Exploring & Analyzing Data: (Part II):
Using the bivariate data collected in the “Data Collection” part of the project, develop a linear regression model.
Calculate and interpret correlation coefficient, coefficient of determination, residual model, and standard error
of the estimate. {Students should transform the data if the data appears to be not linear.} Minitab output with
appropriately annotated formulas are a necessary piece of this part of the project. Students must submit their
work for teacher feedback. Note: A test of significance for the slope of the regression line must be included in
the final report.
6
The course long project will be done in pairs, if there are an odd number of students, one group will have three students.
Page 6 of 7
Point Estimate for Data:
Using the bivariate data collected in the “Data Collection” part of the project, calculate a point estimate for the
population using the appropriate statistic, critical value, and standard deviation of the statistic. All calculations,
assumptions and conditions must be described. Students must submit their work for teacher feedback.
Hypothesis Testing:
Using the bivariate data collected in the “Data Collection” part of the project, perform a significance test at the
.05 level using the appropriate standardized test statistic, statistic, parameter, and standard deviation of the
statistic. Students must submit their work for teacher feedback.
Conclusion (Final Report):
Organize all previous work, summarize your findings and conclusions, discuss what you learned from this
project, what would you have done differently knowing what you know now, and provide a copy of the
PowerPoint Slides you will use in your oral presentation to the class.
Page 7 of 7

