Statistics 10 - Introduction to Statistical Reasoning
advertisement
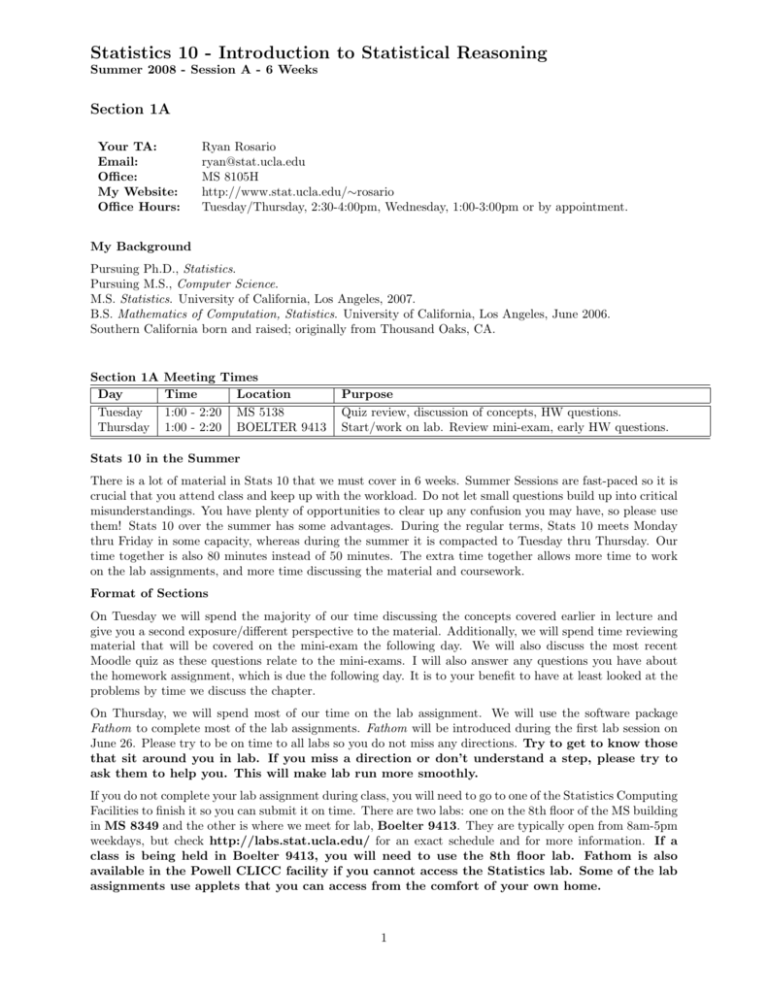
Statistics 10 - Introduction to Statistical Reasoning Summer 2008 - Session A - 6 Weeks Section 1A Your TA: Email: Office: My Website: Office Hours: Ryan Rosario ryan@stat.ucla.edu MS 8105H http://www.stat.ucla.edu/∼rosario Tuesday/Thursday, 2:30-4:00pm, Wednesday, 1:00-3:00pm or by appointment. My Background Pursuing Ph.D., Statistics. Pursuing M.S., Computer Science. M.S. Statistics. University of California, Los Angeles, 2007. B.S. Mathematics of Computation, Statistics. University of California, Los Angeles, June 2006. Southern California born and raised; originally from Thousand Oaks, CA. Section 1A Day Tuesday Thursday Meeting Times Time Location 1:00 - 2:20 MS 5138 1:00 - 2:20 BOELTER 9413 Purpose Quiz review, discussion of concepts, HW questions. Start/work on lab. Review mini-exam, early HW questions. Stats 10 in the Summer There is a lot of material in Stats 10 that we must cover in 6 weeks. Summer Sessions are fast-paced so it is crucial that you attend class and keep up with the workload. Do not let small questions build up into critical misunderstandings. You have plenty of opportunities to clear up any confusion you may have, so please use them! Stats 10 over the summer has some advantages. During the regular terms, Stats 10 meets Monday thru Friday in some capacity, whereas during the summer it is compacted to Tuesday thru Thursday. Our time together is also 80 minutes instead of 50 minutes. The extra time together allows more time to work on the lab assignments, and more time discussing the material and coursework. Format of Sections On Tuesday we will spend the majority of our time discussing the concepts covered earlier in lecture and give you a second exposure/different perspective to the material. Additionally, we will spend time reviewing material that will be covered on the mini-exam the following day. We will also discuss the most recent Moodle quiz as these questions relate to the mini-exams. I will also answer any questions you have about the homework assignment, which is due the following day. It is to your benefit to have at least looked at the problems by time we discuss the chapter. On Thursday, we will spend most of our time on the lab assignment. We will use the software package Fathom to complete most of the lab assignments. Fathom will be introduced during the first lab session on June 26. Please try to be on time to all labs so you do not miss any directions. Try to get to know those that sit around you in lab. If you miss a direction or don’t understand a step, please try to ask them to help you. This will make lab run more smoothly. If you do not complete your lab assignment during class, you will need to go to one of the Statistics Computing Facilities to finish it so you can submit it on time. There are two labs: one on the 8th floor of the MS building in MS 8349 and the other is where we meet for lab, Boelter 9413. They are typically open from 8am-5pm weekdays, but check http://labs.stat.ucla.edu/ for an exact schedule and for more information. If a class is being held in Boelter 9413, you will need to use the 8th floor lab. Fathom is also available in the Powell CLICC facility if you cannot access the Statistics lab. Some of the lab assignments use applets that you can access from the comfort of your own home. 1 A Summary of Your Weekly Responsibilities Of course, you are also responsible for reading the material and reviewing practice problems in addition to the quizzes, labs, exams and homework assignments. BOLDED items are classinmeeting Class Times Bold times. Underlined items are due at the listed time. Italics represent the time of your exams. Due Items are Underlined TUESDAY WEDNESDAY THURSDAY FRIDAY 10:00 Prof. Ioudina’s Office Hours 11:00 (HW due) (Mini-Exam) LECTURE LECTURE 12:00 LECTURE Prof. Ioudina’s Office Hours 1:00 DISCUSSION 2:00 3:00 4:00 . . . 11:50 Ryan’s Office Hours (MS 8105H) Ryan’s Office Hours (MS 8105H) (Lab Due) LAB Ryan’s Office Hours (MS 8105H) Quiz Attempt 1 Quiz Attempt 2 Where to Get Help If you need help in this class, there are plenty of resources available to you: • My office hours as well as Prof. Ioudina’s office hours. • You can email me (or the professor). I usually respond pretty quickly. • AAP (Campbell Hall), Athletics (Covel 209) or Academics in the Commons (Covel 230) may offer Statistics 10 tutoring for eligible students during the summer. Please check with them before going to visit. • For outside help, check out the list of Statistics tutors at http://teaching.stat.ucla.edu/tutoring/. These are other graduate students in the Department that can offer a more structured environment for one-on-one help. This is not free. • If you want more practice, you can try non-assigned problems in the textbook with available solutions in the back. I also recommend these books that I used when I took this course: Statistics Problem Solvers, Research & Education Association, 1978. A giant book of just practice problems with complete solutions. It is dated, but still relevant to today’s curriculum. There are others in this series that cover most topics in mathematics and science including calculus, advanced and vector calculus, physics, chemistry, differential equations, linear algebra and various engineering courses. Schaum’s Outline of Probability and Statistics, M. R. Spiegel, et. al., 2000. This book is probably more useful for the inferential statistics part of this course. This is also a very large series covering lower-division mathematics and science, as well as some upper-division courses. 2 Why are “They” Making me Take this Class? Perhaps early on in your education this is a question worth entertaining. Statistics and many other fields go hand in hand. Some fields cannot exist without Statistics, and other fields use Statistics to prove statements or as the glue that connects two thoughts or disciplines together. Below is a list of fields and a bit about how Statistics can be used in each. We will not discuss these in this course, but I want to take this opportunity to show you the power of Statistics and how useful it can be. Psychology and Education. Psychologists and educational researchers are always finding ways to test new methods of treatment for conditions, or new techniques for teaching and evaluating others. In both fields, these types of studies require experiments to be carefully constructed and carried out while respecting the privacy of any human subjects that may be involved. The field of Psychometrics is a branch of Statistics that deals with the accurate and unbiased estimation of some underlying characteristic of an individual that is not physical. In Psychology, this trait may be “intelligence” or “depression” and may be measured using questionnaires, observations, or some rating scale. In educational research, the same instruments are typically used, but in educational testing, standardized tests are used (i.e. SAT, ACT, CAT/6, STAR etc.). Statistics is used not only in the reporting of test scores, but also as a way to determine the quality of each and every test question (or task in psychology) and to protect assessments (or scales) against demographic or statistical bias. Psychometrics is also used to ensure that two completely different tests with completely different questions measure the same skills (i.e. several forms of the SAT per test day). Linguistics. Words, sentences and other language objects can be counted and quantified just as numbers can be. For example, behavioral psychologists and political scientists use pronoun counts to determine how selfless a person or candidate is. Word emotion (positive, negative, happy, sad) can be used to judge the feelings or tone of a person. But why is this necessary? Well, the fun is that Statisticians and Computer Scientists are training computers to do this so processing large datasets becomes quicker and cheaper. Then there is the immense world of natural language processing which I won’t even get into here! Computer Science. On the Internet, we leave traces of ourselves everywhere. Web server access logs, blogs, social networking sites, emails, IMs. Devices such as cell phones and PDAs are becoming increasingly useful in the sharing of information. Fusing and merging all of this trace data together can provide a very elaborate story of a person. The Internet itself is a huge data warehouse from the number of bytes transferred using different programs to the way data is transported reliably from point A to point B. Computer hard disks and cell phones use Statistics to correct data that has become corrupted using statistical methods. Where there is data exchange and information sharing, there is Statistics! (This is my field of interest, in addition to Social Network Analysis.) Biology. If you are interested in Biology, see my Stats 13 syllabus from Fall 2007: http://www.stat.ucla.edu/∼rosario/classes/07F/13/syllabus.pdf. Political Science. Polls, polls and more polls. Will it ever end? Election outcome forecasting has become a huge market. Issues of sampling, bias and the margin of error are crucial in polls and poor choices sometimes render the results useless. Tread lightly when reading poll results! Economics. One of the original uses of Statistics. Forecasting and predicting stock market prices and their changes over time. A popular career choice for Math and Stats majors is in actuarial science. Actuaries work for insurance companies and deal with risk. For how much should we insure Johnny Knoxville? Art. Art is a way of expressing emotion, or evoking emotion from an audience. In Statistics, we collaborate with individuals in Design | Media Art to produce visualizations of data that will evoke emotion from those that view it: to persuade, to “edutain,” to encourage different ways to think about a problem. Art is important in Statistics; without it we bore people out of their minds. Sociology. Social Network Analysis studies characteristics of individuals as well as their associations with and among other individuals. Some mainstream examples of SNA data are sites such as MySpace, Facebook, Digg and Twitter. A Statistician can tell a lot about a person by looking at their connections. Social Network Analysis is used to fight crime. Government agencies use SNA to search for Osama bin Laden as well as track and predict changes and movement in the structure of Al Qaida. 3 Sports and “Games involving Cards and Dice.” Sports are highly complex systems of players, rules, teams, and team configurations. There are hundreds and hundreds of variables that can explain a player’s performance in a certain game or season. Once we understand the behavior of these variables, we can predict outcomes. Sabermetrics is exactly this, but applied only the baseball. Team “trade” choices can be made into a statistical problem to optimize the performance of some other team (and their revenue of course). Games involving cards and dice are a trivial example of Statistics. The correct strategy can improve your game. Likewise, the correct strategy can minimize the chance of winning! If you like this class, and you like poker, you may consider taking Statistics 35B: Introduction to Probability with Applications to Poker. With the spread of information using vehicles such as the Internet and wireless technologies, data and patterns waiting to be uncovered surround us more than ever. These patterns reveal knowledge that would not be discoverable in a non-digital form. Making sense of this data using visualization and statistical analysis is our way of converting a bunch of “stuff” (not just numbers, but also words, emails, online identities etc.) into knowledge. This is why “they” are making you learn a bit about Statistics! If you enjoy the material covered in this class, you may want to consider a major or minor in Statistics. For more information, visit Glenda Jones in Math Sciences 8117 or visit http://student-services.stat.ucla.edu. 4
