Graphing Square Roots 83
advertisement

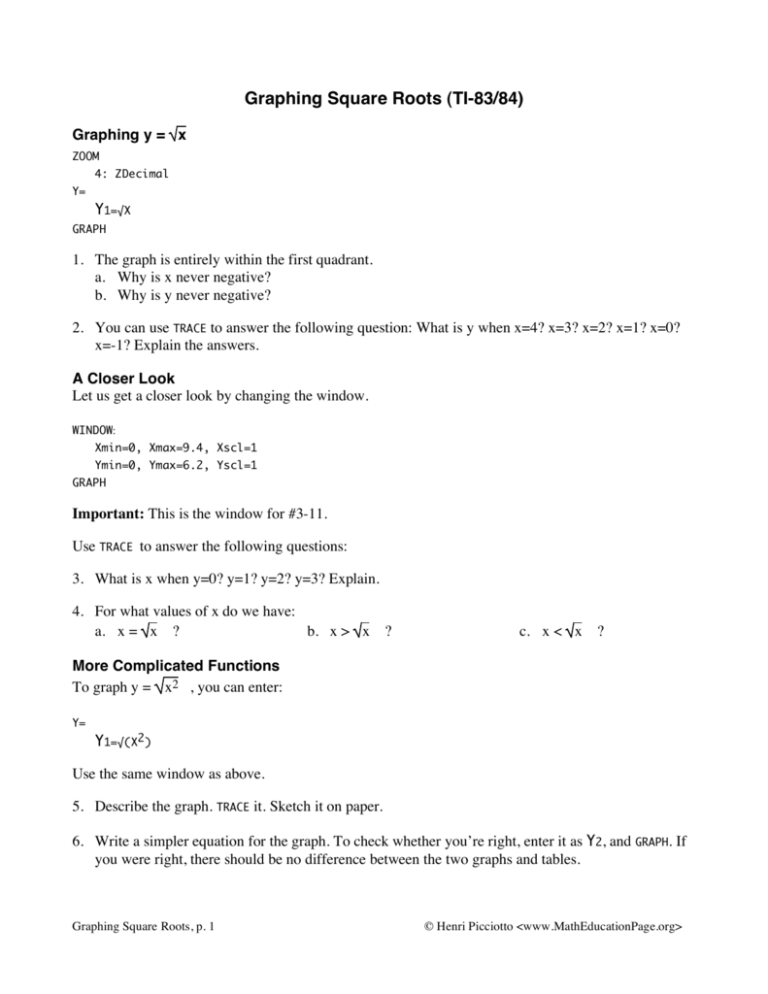
Graphing Square Roots (TI-83/84) Graphing y = x ZOOM 4: ZDecimal Y= Y1=√X GRAPH 1. The graph is entirely within the first quadrant. a. Why is x never negative? b. Why is y never negative? 2. You can use TRACE to answer the following question: What is y when x=4? x=3? x=2? x=1? x=0? x=-1? Explain the answers. A Closer Look Let us get a closer look by changing the window. WINDOW: Xmin=0, Xmax=9.4, Xscl=1 Ymin=0, Ymax=6.2, Yscl=1 GRAPH Important: This is the window for #3-11. Use TRACE to answer the following questions: 3. What is x when y=0? y=1? y=2? y=3? Explain. 4. For what values of x do we have: a. x = x ? b. x > x ? c. x < x ? More Complicated Functions To graph y = x2 , you can enter: Y= Y1=√(X2) Use the same window as above. 5. Describe the graph. TRACE it. Sketch it on paper. 6. Write a simpler equation for the graph. To check whether you’re right, enter it as Y2, and GRAPH. If you were right, there should be no difference between the two graphs and tables. Graphing Square Roots, p. 1 © Henri Picciotto <www.MathEducationPage.org> Clear Y1 and Y2. For each function below: a. Predict what the graph will look like b. Enter the function as Y1. (Be sure to put parentheses around the quantity that is under the radical.) c. GRAPH.Sketch. d. If possible, write a simpler equation for the graph. You may get an idea for it by using TRACE. Check your answer by entering your equation as Y2, and graphing it. After each problem, clear Y1 and Y2. 7. y = 4x2 9. y= y = x2 + 4 8. x2 4 10. One of these graphs was not a line. Which one? Why? Note that all this work has been done in the first quadrant, where x is positive. 11. When x is positive: a. x2 = x2 = c. 4 b. 4x2 = Negative Values of x To see what happens with negative values of x, we will change the window. WINDOW: Xmin=-9.4, Xmax=0, Xscl=1 Ymin=0, Ymax=6.2, Yscl=1 Important: This is the window for #12-17. For each function below: a. Predict what the graph will look like b. Enter the function as Y1. (Be sure to put parentheses around the quantity that is under the radical.) c. GRAPH.Sketch. d. If possible, write a simpler equation for the graph. You may get an idea for it by using TRACE . Check your answer by entering your equation as Y2, and graphing it. After each problem, clear Y1 and Y2. 12. y = x2 15. y= 13. y = 4x2 14. y = x2 + 4 x2 4 Graphing Square Roots, p. 2 © Henri Picciotto <www.MathEducationPage.org> Note that this was all done in the second quadrant, where x is negative. 16. When x is negative: a. x2 = b. 4x2 = x2 = c. 4 17. Compare the formulas you found in #11 and #16. Looking at All Four Quadrants ZOOM 4: ZDecimal What do you think the graph of y = x2 will look like if you can see all four quadrants? GRAPH and find out. Sketch the graph on paper. b. Write a simpler equation for the graph. To check whether you’re right, enter it as Y2, and GRAPH. Compare with your sketch. If you were right, there should be no difference between the two graphs and tables. 18. a. Repeat #18 for the following functions: 19. y = 4x2 20. y = x2 + 4 21. y = x2 4 Simplifying Radical Expressions 22. Simplify the following expressions. Make sure your method works for both positive and negative values of x. a. x2 = b. 9x2 = x2 = c. 9 23. My former student Hank believes that x2 + 9 = x + 3. Explain why he is wrong. 24. Summary: Summarize what you learned about the absolute value and square root functions. What is the definition of absolute value? (Hint: it is a piecewise function.) When can you simplify radical expressions? How is this related to absolute value? Graphing Square Roots, p. 3 © Henri Picciotto <www.MathEducationPage.org>


