Tutorial & p. 592 Answers
advertisement
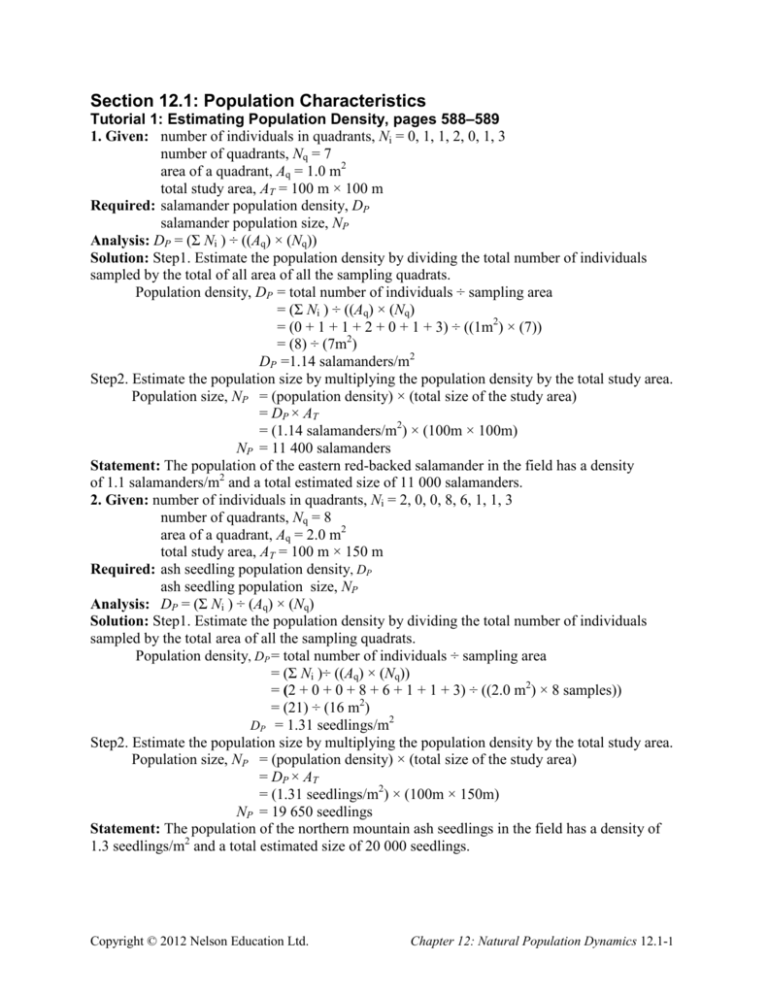
Section 12.1: Population Characteristics Tutorial 1: Estimating Population Density, pages 588–589 1. Given: number of individuals in quadrants, Ni = 0, 1, 1, 2, 0, 1, 3 number of quadrants, Nq = 7 area of a quadrant, Aq = 1.0 m2 total study area, AT = 100 m × 100 m Required: salamander population density, DP salamander population size, NP Analysis: DP = (Σ Ni ) ÷ ((Aq) × (Nq)) Solution: Step1. Estimate the population density by dividing the total number of individuals sampled by the total of all area of all the sampling quadrats. Population density, DP = total number of individuals ÷ sampling area = (Σ Ni ) ÷ ((Aq) × (Nq) = (0 + 1 + 1 + 2 + 0 + 1 + 3) ÷ ((1m2) × (7)) = (8) ÷ (7m2) DP =1.14 salamanders/m2 Step2. Estimate the population size by multiplying the population density by the total study area. Population size, NP = (population density) × (total size of the study area) = DP × AT = (1.14 salamanders/m2) × (100m × 100m) NP = 11 400 salamanders Statement: The population of the eastern red-backed salamander in the field has a density of 1.1 salamanders/m2 and a total estimated size of 11 000 salamanders. 2. Given: number of individuals in quadrants, Ni = 2, 0, 0, 8, 6, 1, 1, 3 number of quadrants, Nq = 8 area of a quadrant, Aq = 2.0 m2 total study area, AT = 100 m × 150 m Required: ash seedling population density, DP ash seedling population size, NP Analysis: DP = (Σ Ni ) ÷ (Aq) × (Nq) Solution: Step1. Estimate the population density by dividing the total number of individuals sampled by the total area of all the sampling quadrats. Population density, DP = total number of individuals ÷ sampling area = (Σ Ni )÷ ((Aq) × (Nq)) = (2 + 0 + 0 + 8 + 6 + 1 + 1 + 3) ÷ ((2.0 m2) × 8 samples)) = (21) ÷ (16 m2) 2 DP = 1.31 seedlings/m Step2. Estimate the population size by multiplying the population density by the total study area. Population size, NP = (population density) × (total size of the study area) = DP × AT = (1.31 seedlings/m2) × (100m × 150m) NP = 19 650 seedlings Statement: The population of the northern mountain ash seedlings in the field has a density of 1.3 seedlings/m2 and a total estimated size of 20 000 seedlings. Copyright © 2012 Nelson Education Ltd. Chapter 12: Natural Population Dynamics 12.1-1 Tutorial 2: Estimating Population Size, pages 589–590 1. Given: total number of animals captured, marked, and released on the first visit, M = 75 total number of animals captured on the second visit, n = 45 number of marked animals that were recaptured on the second visit, m = 15 Required: total population size, N Analysis: N = M × n ÷ m Solution: Estimate the total population size by multiplying the number of marked individuals by the ratio of the number of individuals captured to the number of marked individuals captured. Population size, N = M × n ÷ m = (75 foxes) × (45 foxes) ÷ (15 foxes) N =225 foxes Statement: The population of the red foxes is 225. 2. Given: total number of animals captured, marked, and released on the first visit, M = 208 total number of animals captured on the second visit, n = 185 number of marked animals that were recaptured on the second visit, m = 13 Required: total population size, N Analysis: N = M × n ÷ m Solution: Estimate the total population size by multiplying the number of marked individuals by the ratio of the number of individuals captured to the number of marked individuals captured. Population size, N = M × n ÷ m = (208 trout) × (185 trout) ÷ (13 trout) N = 2960 trout Statement: The population of the trout in the lake is 2960. 3. Given: total number of animals captured, marked, and released on the first visit, M = 208 total number of animals captured on the second visit, n = 185 number of marked animals that were recaptured on the second visit, m = 13 Required: total population size, N Analysis: N = M × n ÷ m Solution: Estimate the total population size by multiplying the number of marked individuals by the ratio of the number of individuals captured to the number of marked individuals captured. Population size, N = M × n ÷ m = (180 butterflies) × (210 butterflies) ÷ (30 butterflies) N =1260 butterflies Statement: The population of the butterflies in in the park is 1260. Section 12.1 Questions, page 592 1. (a) Dispersion may be random, uniform, or clumped. (b) Answers may vary. Sample answer: No, population dispersion patterns vary through time in response to the supply of resources and seasonal habitat changes. 2. Answers may vary. Students’ answer will depended on the website chosen, however observations might include how many times a mother feeds hatchlings, and what they are fed, or the duration of sleep and waking cycles. Sample answer: (a) Elephants. (b) The elephants travelled between 0.89 and 1.58 km each day. (c) The elephants spent most of their time in forests on dry land below 300 m above sea level. Copyright © 2012 Nelson Education Ltd. Chapter 12: Natural Population Dynamics 12.1-2 (d) The data are being used by the scientists to determine in what parts of their habitat the elephants spend their time and to see how large the elephants’ ranges are. (e) The data can help protect endangered species by recommending locations for protected areas and where human activities are likely to intersect with the animals in a negative way. 3. 4. (a) Garlic mustard was introduced into North America in the 1800s for medicinal purposes and as a salad plant. It is native to Europe. (b) The major problem is that garlic mustard alters the mycorrhizae, a symbiosis between plants and fungi by which the fungi obtain nutrients for the plant and the plant creates carbon for the fungi. When the mycorrhizae are altered, cascade failure of nutrient cycling results and reduces competitiveness of native plants. (c) Garlic mustard grows best in disturbed areas, so it is being controlled by leaving areas in their natural state. If garlic mustard does begin growing in an area, it is being controlled by pulling it up, digging it up, and using pesticides continuously so that it does not set seed. 5. Given: total number of animals captured, marked, and released on the first visit, M = 18 bears total number of animals captured on the second visit, n = 16 bears number of marked animals that were recaptured on the second visit, m = 5 bears Required: total population size, N Analysis: N = M × n ÷ m Solution: Step1. Estimate the total population size by multiplying the number of marked individuals by the ratio of the number of individuals captured to the number of marked individuals captured. Population size, N = M × n ÷ m = (18 bears) × (16 bears) ÷ (5 bears) N = 57.6 bears Statement: The population of the bears in the forested area is about 60. Copyright © 2012 Nelson Education Ltd. Chapter 12: Natural Population Dynamics 12.1-3 6. (a) Given: number of individuals in quadrants, Ni = 6, 10, 2, 4, 7 number of quadrants, Nq = 5 area of a quadrant, Aq = 1.0 m2 total study area, AT = 40.0 m × 40.0 m Required: dandelion population density, DP dandelion population size, NP Analysis: DP = (Σ Ni ) ÷ ((Aq) × (Nq)) Solution: Step1. Estimate the population density by dividing the total number of individuals sampled by the total area of all the sampling quadrants. Population density, DP = total number of individuals ÷ sampling area = (Σ Ni ) ÷ ((Aq) × (Nq)) = (6 + 10 + 2 + 4 + 7) ÷ ((1.0m2) × 5)) = (29) ÷ (5.0 m2)) DP = 5.8 seedlings/m2 Step2. Estimate the population size by dividing the total number of individuals sampled by the total study area. Population size, NP = (population density) × (total size of the study area) = DP × AT = (5.8 dandelions/m2) × (40.0 m × 40.0 m) NP = 9280 seedlings Statement: The population of the dandelions has a density of 5.8 seedlings/m2 and a total estimated size of 9300 dandelions. (b) The assumption that the student is making is that the randomly selected areas sampled are representative of the entire site. A good sample should be about 10 % of the total area studied; the sample taken was less than 1 % of the studied area. 7. Answers may vary. Students’ answer should be well supported. Sample answers: (a) The mark-recapture technique would be easier to implement because if scientists used quadrat sampling, the area would have to be measured and organized into quadrats. The prairie dogs are not stationary and they are burrowers so the biologist would be spending a great deal of time observing, possibly using video. It would be difficult for scientists to know if they counted animals twice without some kind of marking. (b) The quadrat sampling technique would be more effective because using mark-recapture techniques it would be difficult to ensure that all assumptions were adequately met (because of the burrowing issues). 8. (a) Answers may vary. Sample answer: Some challenges researchers may experience include that caribou are large and fast so counting will be difficult. Their habitat is rugged and mountainous. Aerial counting or satellite images would likely be easiest although mark-recapture is a possibility. (b) Answers may vary. Students’ answer should focus on the ethics of studying wild populations. Sample answer: Possible short-term effects of studying the caribou population include increased stress on the animals from human interactions, especially with the mark-recapture method. Possible long-term effects include better policies regarding hunting and environmental protection that are based on real knowledge about the dynamics of the caribou population. Copyright © 2012 Nelson Education Ltd. Chapter 12: Natural Population Dynamics 12.1-4
