Vol 463 | 25 February 2010 | doi:10.1038/nature08814
LETTERS
Exploring the thermodynamics of a universal Fermi gas
S. Nascimbène1, N. Navon1, K. J. Jiang1, F. Chevy1 & C. Salomon1
One of the greatest challenges in modern physics is to understand
the behaviour of an ensemble of strongly interacting particles. A
class of quantum many-body systems (such as neutron star matter
and cold Fermi gases) share the same universal thermodynamic
properties when interactions reach the maximum effective value
allowed by quantum mechanics, the so-called unitary limit1,2. This
makes it possible in principle to simulate some astrophysical
phenomena inside the highly controlled environment of an atomic
physics laboratory. Previous work on the thermodynamics of
a two-component Fermi gas led to thermodynamic quantities
averaged over the trap3–5, making comparisons with many-body
theories developed for uniform gases difficult. Here we develop a
general experimental method that yields the equation of state of a
uniform gas, as well as enabling a detailed comparison with existing theories6–15. The precision of our equation of state leads to new
physical insights into the unitary gas. For the unpolarized gas, we
show that the low-temperature thermodynamics of the strongly
interacting normal phase is well described by Fermi liquid theory,
and we localize the superfluid transition. For a spin-polarized
system16–18, our equation of state at zero temperature has a 2 per
cent accuracy and extends work19,20 on the phase diagram to a new
regime of precision. We show in particular that, despite strong
interactions, the normal phase behaves as a mixture of two ideal
gases: a Fermi gas of bare majority atoms and a non-interacting gas
of dressed quasi-particles, the fermionic polarons10,18,20–22.
In this Letter we study the thermodynamics of a mixture of the two
lowest spin states (i 5 1, 2) of 6Li prepared at a magnetic field B 5 834 G
(see Methods), where the dimensionless number 1/kFa characterizing
the s-wave interaction is equal to zero, the unitary limit. (Here kF is the
Fermi momentum and a the scattering length.) Understanding the
universal thermodynamics at unitarity is a challenge for many-body
theories because of the strong interactions between particles. Despite
this complexity at the microscopic scale, all the macroscopic properties
of an homogeneous system are encapsulated within a single equation of
state (EOS), P(m1, m2, T), that relates the pressure P of the gas to the
chemical potentials mi of the species i and to the temperature T. In the
unitary limit, this relationship can be expressed as1:
m
{m1
ð1Þ
P ðm1 , m2 , T Þ~P1 ðm1 , T Þh g~ 2 , f~exp
m1
kB T
{1 where P1 ðm1 , T Þ~{kB T l{3
is the pressure of a single
dB ðT Þf5=2 {f
component non-interacting Fermi gas. Here kB is the Boltzmann conP
stant, ldB(T) is the de Broglie wavelength and f5=2 ðz Þ~ ? z n n5=2 :
n~1
h(g,f) is a universal function which contains all the thermodynamic
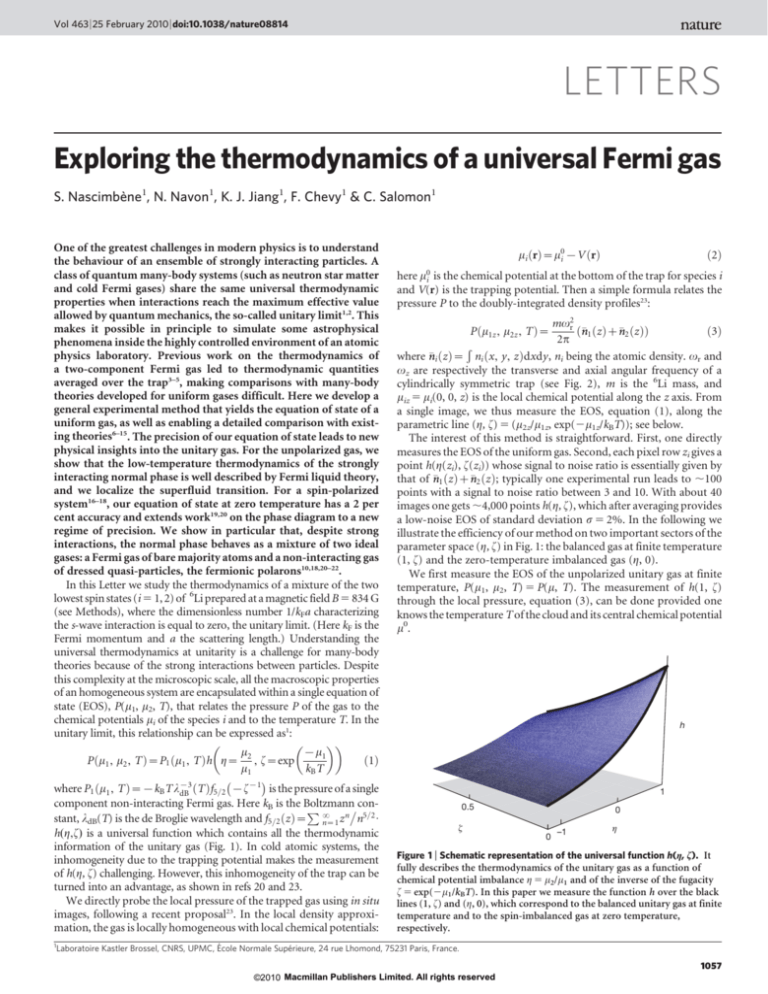
information of the unitary gas (Fig. 1). In cold atomic systems, the
inhomogeneity due to the trapping potential makes the measurement
of h(g, f) challenging. However, this inhomogeneity of the trap can be
turned into an advantage, as shown in refs 20 and 23.
We directly probe the local pressure of the trapped gas using in situ
images, following a recent proposal23. In the local density approximation, the gas is locally homogeneous with local chemical potentials:
1
mi ðrÞ~m0i {V ðrÞ
ð2Þ
here m0i is the chemical potential at the bottom of the trap for species i
and V(r) is the trapping potential. Then a simple formula relates the
pressure P to the doubly-integrated density profiles23:
mv2r
1 ðz Þz
ðn
n2 ðz ÞÞ
ð3Þ
P ðm1z , m2z , T Þ~
2p
Ð
i ðz Þ~ ni ðx, y, z Þdxdy, ni being the atomic density. vr and
where n
vz are respectively the transverse and axial angular frequency of a
cylindrically symmetric trap (see Fig. 2), m is the 6Li mass, and
miz 5 mi(0, 0, z) is the local chemical potential along the z axis. From
a single image, we thus measure the EOS, equation (1), along the
parametric line (g, f) 5 (m2z/m1z, exp(2m1z/kBT)); see below.
The interest of this method is straightforward. First, one directly
measures the EOS of the uniform gas. Second, each pixel row zi gives a
point h(g(zi), f(zi)) whose signal to noise ratio is essentially given by
1 ðz Þz
that of n
n2 ðz Þ; typically one experimental run leads to ,100
points with a signal to noise ratio between 3 and 10. With about 40
images one gets ,4,000 points h(g, f), which after averaging provides
a low-noise EOS of standard deviation s 5 2%. In the following we
illustrate the efficiency of our method on two important sectors of the
parameter space (g, f) in Fig. 1: the balanced gas at finite temperature
(1, f) and the zero-temperature imbalanced gas (g, 0).
We first measure the EOS of the unpolarized unitary gas at finite
temperature, P(m1, m2, T) 5 P(m, T). The measurement of h(1, f)
through the local pressure, equation (3), can be done provided one
knows the temperature T of the cloud and its central chemical potential
m0.
h
1
0.5
ζ
0
0
–1
η
Figure 1 | Schematic representation of the universal function h(g, f). It
fully describes the thermodynamics of the unitary gas as a function of
chemical potential imbalance g 5 m2/m1 and of the inverse of the fugacity
f 5 exp(2m1/kBT). In this paper we measure the function h over the black
lines (1, f) and (g, 0), which correspond to the balanced unitary gas at finite
temperature and to the spin-imbalanced gas at zero temperature,
respectively.
Laboratoire Kastler Brossel, CNRS, UPMC, École Normale Supérieure, 24 rue Lhomond, 75231 Paris, France.
1057
©2010 Macmillan Publishers Limited. All rights reserved
LETTERS
NATURE | Vol 463 | 25 February 2010
a
x
Virial 4
2.5
z
y
2.0
imaging
7Li
imaging
Virial 2
h(1,ζ)/2
6Li
1.5
Figure 2 | Schematic representation of our atomic sample. The 6Li atomic
cloud is imaged in the direction y; the column density is then integrated
ðz Þ. The 7Li atoms are imaged after a time of
along the direction x to give n
flight along the z direction.
Virial 3
1.0
Here P1(m, 0) 5 1/15p2(2m/"2)3/2m5/2 is the pressure of a singlecomponent Fermi gas at zero temperature, m* is the quasi-particle
mass, and j{1
n is the compressibility of the normal gas extrapolated to
zero temperature, and normalized to that of an ideal gas of same
density. We deduce two new parameters m*/m 5 1.13(3) and
jn 5 0.51(2). Despite the strong interactions, m* is close to m, unlike
the weakly interacting 3He liquid for which 2.7 , m*/m , 5.8, depending on pressure. Our jn value is in agreement with the variational
fixed-node Monte Carlo calculations jn 5 0.54 in ref. 27 and
Ideal Fermi gas
0.05
0.10
0.50
ζ
b
1.00
5.00
c
8
P(µ,T)/2P1(µ,0)
In the balanced case, model-independent thermometry is notoriously
difficult because of the strong interactions. Inspired by ref. 24, we overcome this issue by measuring the temperature of a 7Li cloud in thermal
equilibrium with the 6Li mixture (see Methods).
The central chemical potential m0 is fitted on the hottest clouds so
that the EOS agrees in the classical
regime
pfffiffiffi?
1 with the secondorder virial expansion hð1, fÞ<2 1zf{1 2 (ref. 25). For colder
clouds we proceed recursively. The EOS of an image recorded at
temperature T has some overlap with the previously determined
EOS from all images with T9 . T. In this overlap region, m0 is fitted
to minimize the distance between the two EOSs. This provides a new
portion of the EOS at lower temperature. Using 40 images of clouds
prepared at different temperatures, we thus reconstruct a low-noise
EOS from the classical part down to the degenerate regime, as shown
in Fig. 3a.
We now comment on the main features of the EOS. At high temperature, the EOS can be expanded in powers of f21 as a virial
expansion11:
P? kz1 {5=2
f{k
ð
{1
Þ
k
zb
k
k~1
hð1, fÞ
~
P?
kz1 {5=2 {k
2
k
f
k~1 ð{1Þ
pffiffiffi
th
where bk is the k virial coefficient. As we have b2 ~1 2 in the
measurement scheme described above, our data provide for the first
time the experimental values of b3 and b4. b3 5 20.35(2) is in excellent
agreement with the recent calculation b3 5 20.291 2 325/2 5 20.355
from ref. 11, but not with b3 5 1.05 from ref. 12. b4 5 0.096(15)
involves the four-fermion problem at unitarity and could interestingly
be computed along the lines of ref. 11.
Let us now focus on the low-temperature regime of the normal
phase f = 1. As shown in Fig. 3b, we observe a T2 dependence of
the pressure with temperature. This behaviour is reminiscent of a
Fermi liquid, and indicates that pseudogap effects expected for
strongly interacting Fermi superfluids26 do not show up at the thermodynamic level within our experimental precision. In analogy with
3
He or heavy-fermion metals, we fit our data with the EOS:
!
5p2 {1=2 m kB T 2
{3=2
ð4Þ
P ðm, T Þ~2P1 ðm, 0Þ jn z
j
m
8 n
m
6
ζ –3/2
s
4
ζ –3/2
ζ –3/2
2
1
0
0
4
NIFG
0.2
s
n
0.4
(kBT/µ)2
0.6
3.5
0.05
0.1
(kBT/µ)2
0.15
Figure 3 | Equation of state of a spin-balanced unitary Fermi gas. a, Finitetemperature equation of state (EOS) h(1, f) (black dots). The error bars
represented at f 5 0.14 and f 5 2.3 indicate the 6% accuracy in f and h of our
EOS. The red curves are the successive virial expansions up to fourth order.
The blue triangles are from ref. 6, the green stars from ref. 7, the purple
diamonds from ref. 8, and the blue solid line from ref. 9. The grey region
indicates the superfluid phase. b, EOS P(m, T)/2P1(m, 0) as a function of
(kBT/m)2, fitted by the Fermi liquid EOS, equation (4). The red dashed line is
the non-interacting Fermi gas (NIFG). The horizontal dot-dashed and
dotted lines indicate respectively the zero-temperature pressure of the
and that of the normal phase !j{3=2
. c, Expanded
superfluid phase !j{3=2
s
n
view of b near Tc. The sudden deviation of the data from the fit occurs at
(kBT/m)c 5 0.32(3) that we interpret as the superfluid transition. The black
dashed line indicates the mean value of the data points below Tc.
jn 5 0.56 in ref. 10, and with the quantum Monte Carlo calculation jn 5 0.52 in ref. 28. This yields the Landau parameters
F0s ~jn m =m{1~{0:42 and F1s ~3ðm =m{1Þ~0:39.
In the lowest temperature points (Fig. 3c) we observe a sudden
deviation of the data from the fitted equation (4) at (kBT/m)c 5
0.32(3) (see Supplementary Information). We interpret this behaviour as the transition from the normal phase to the superfluid phase.
This critical ratio has been extensively calculated in recent years. Our
value is in close agreement with the diagrammatic Monte Carlo calculation (kBT/m)c 5 0.32(2) of ref. 6 and with the quantum Monte
Carlo calculation (kBT/m)c 5 0.35(3) of ref. 28; but it differs from the
self-consistent approach in ref. 8 that gives (kBT/m)c 5 0.41, from the
renormalization group prediction 0.24 in ref. 29, and from several
other less precise theories. From equation (4) we deduce the total
density n 5 n1 1 n2 5 hP(mi 5 m, T)/hm and the Fermi energy
EF 5 kBTF 5 "2/2m(3p2n)2/3 at the transition point. We obtain (m/
EF)c 5 0.49(2) and (T/TF)c 5 0.157(15), in very good agreement with
ref. 6. Our measurement is the first direct determination of (m/EF)c
1058
©2010 Macmillan Publishers Limited. All rights reserved
LETTERS
NATURE | Vol 463 | 25 February 2010
Our measured EOS h(g, 0) is displayed in Fig. 4. By construction our
data agree for g>0:1 with equation (5). In Fig. 4 the slope of h(g, 0)
displays an obvious discontinuity for g 5 gc 5 0.065(20). This is a
signature of a first-order quantum phase transition to the partially
polarized normal phase. The error bar is dominated by the uncertainty
on js. This value is slightly higher than the prediction gc 5 0.02 given
by the fixed-node Monte Carlo10 and than the value gc 5 0.03(2) measured in ref. 19.
From the relations ni 5 hP/hmi, we deduce from h(g, 0) the density
ratio n2/n1 (Fig. 4 inset). This ratio is discontinuous at the phase
transition, from a maximum value in the normal phase (n2/n1)c 5
0.5(1) to n2 5 n1 in the superfluid phase. Our value is close to the
zero-temperature calculation 0.44 (ref. 10) and agrees with the coldest
MIT samples19,20. It confirms that the temperature is much smaller
than the tricritical point temperature T 5 0.07TF (ref. 19) where the
discontinuity vanishes, justifying our T 5 0 assumption made above.
For g , gc our data display a good agreement with a simple
polaron model, based on the pioneering work in ref. 10. A polaron
is a quasi-particle describing a single minority atom immersed in the
majority Fermi sea15,18,21,22. It is characterized10 by a renormalized
2.2
n2/n1
1
2.0
1
0.5
0.5
1.8
h(η,0)
and (T/TF)c in the homogeneous gas. It agrees with the extrapolated
value of the MIT measurement19.
Below Tc, advanced theories7,8 predict that P(m, T)/2P1(m, 0) is
nearly constant (Fig. 3b). Therefore at T 5 Tc, P=2P1 <j{3=2
<3:7,
s
and is consistent with our data. Here js 5 0.42(1) is the fundamental
parameter characterizing the EOS of the balanced superfluid at zero
temperature, a quantity extensively measured and computed in
recent years2.
Our data are compared at all temperatures with the calculations
from refs 6–9 in Fig. 3a. The agreement with ref. 7 is very good for a
large range of temperatures. Concerning ref. 6, the deviation from
our data is about one error bar of the Monte Carlo method below
f 5 0.2, and the deviation increases with temperature (Fig. 3a).
Furthermore, we show in the Supplementary Information that h(1,
f)/2 must be greater than 1, an inequality violated by the two hottest
Monte Carlo points of ref. 6.
From our homogeneous EOS we can deduce the EOS of the
harmonically trapped unitary gas by integrating h(1, f) over the
trap (see Supplementary Information). In particular, we find a critical temperature
1=3for the trapped gas (T/TF)c 5 0.19(2), where
TF ~B 3v2r vz N
and N is the total atom number. This value
agrees very well with the recent measurement of ref. 30, and with less
precise measurements5,31,32.
Let us now explore a second line in the universal diagram h(g, f)
(Fig. 1) by considering the case of the T 5 0 spin-imbalanced mixture
m2 =m1 , that is, g=1. Previous work16–18 has shown that phase separation occurs in a trap. Below a critical population imbalance a fully
paired superfluid occupies the centre of the trap. It is surrounded by a
normal mixed phase and an outer rim consisting of an ideal gas of the
majority component. In two out of the three previous experiments
including ours16,18, the local density approximation has been carefully
checked. We are therefore justified in using equation (3) to analyse
our data.
As in the previous case, the relationship between the pressure and the
EOS requires the knowledge of the chemical potentials m01 and m02 at the
centre of the trap. m01 is determined using the outer shell of the majority
spin component (i 5 1). The pressure profile P(m1z, m2z, 0) corresponds
to the Fermi–Dirac
distribution
with the Thomas–Fermi
5=2 and is fitted
formula P1 ~a 1{z 2 R12
, providing m01 ~ 12 mv2z R12 . Using P1 for
the calculation of h 5 P/P1 cancels many systematic effects on the
absolute value of the pressure. Moreover, fitting the outer shell using
a finite-temperature Thomas–Fermi profile19, we measure a temperature kB T ~0:03ð3Þm01 . m02 is fitted by comparison in the superfluid
region with the superfluid EOS at zero temperature21:
.
ð5Þ
hðg, 0Þ~ð1zgÞ5=2 ð2js Þ3=2
ηc
0
1.6
–0.2
A
1.4
0
η
0.2
0
1.2
ηc
1.0
–1.0
–0.8
–0.6
–0.4
η
–0.2
0.0
0.2
Figure 4 | Equation of state of the zero-temperature spin-imbalanced
unitary gas h(g, 0). The EOS is shown as filled black circles; error bars are
equal to one standard error. The red solid line is the superfluid EOS, the blue
dashed line is the ideal Fermi liquid, equation (7), with A 5 20.615,
m* 5 1.20m and the black dotted line is the Monte Carlo calculation from
ref. 10. Inset, local density ratio n2/n1 as a function of g. The red solid line n2/
n1 5 1 corresponds to the fully paired superfluid and blue dashed line to the
model, equation (7).
chemical potential m2 2 Am1 and an effective mass mp . Following this
picture, we write the pressure as the sum of the Fermi pressures of
ideal gases of majority atoms and of polarons:
!
3=2
3=2
mp
1
2m
5=2
5=2
P~
ð6Þ
m1 z
ðm2 {Am1 Þ
m
15p2 B2
which can be written as:
3=2
mp
hðg, 0Þ~1z
ðg{AÞ5=2
m
ð7Þ
A and mp have recently been calculated exactly14,15: A 5 20.615,
.
mp m~1:20ð2Þ, and with these values inserted in equation (7) the
agreement with our data is perfect. Note that our data lie slightly
above the variational fixed-node Monte Carlo calculation10. We
therefore conclude that interactions between polarons are not visible
at this level of precision.
.
m as a free parameter in
Alternatively, we can fit our
data
with
m
p
.
equation (7). We obtain mp m~1:20ð2Þ. The uncertainty combines
the standard error of the fit and the uncertainty
. on js. This value
agrees with our previous measurement18 mp m~1:17ð10Þ (with a
14,15
fivefold
. improvement in precision), with the theoretical value
mp m~1:20ð2Þ, and with the variational calculation13. It differs
from the values 1.09(2) in ref. 33, 1.04(3) in ref. 10, and from the
experimental value 1.06 in ref. 20.
We arrive at a simple physical picture of the T 5 0 spin-polarized
gas: the fully paired superfluid is described by an ideal gas EOS
renormalized by a single coefficient js; the normal phase is nothing
but two ideal gases, one of bare majority particles and one of polaronic quasiparticles.
In conclusion, we have introduced a powerful method for the
measurement of the EOS of the unitary and homogeneous Fermi
gas that enables direct comparison with theoretical models and
provides a set of new parameters shown in Table 1. The method
Table 1 | Table of quantities measured in this work
Parameter
Value
b3
20.35(2)
b4
0.096(15)
(kBT/m)c
0.32(3)
(m/EF)c
0.49(2)
Parameter
jn
m*/m
gc
(n2/n1)c
Value
0.51(2)
1.13(3)
0.065(20)
0.5(1)
(T/TF)c
0.157(15)
.
mp m
1.20(2)
1059
©2010 Macmillan Publishers Limited. All rights reserved
LETTERS
NATURE | Vol 463 | 25 February 2010
can readily be extended to any multi-component cold atom gas in
three dimensions that fulfils the local density approximation (see
Supplementary Discussion). We have shown that the normal phase
of the unitary Fermi gas is a strongly correlated system whose
thermodynamic properties are well described by Fermi liquid theory,
unlike high-Tc copper oxides.
Note added in proof: Since this paper was accepted for publication, we
have become aware of the measurement of a similar equation of state
for the balanced unitary Fermi gas at finite temperature by different
methods34.
METHODS SUMMARY
Our experimental set-up is presented elsewhere18. We load into an optical
dipole trap and evaporate a mixture of 6Li in the j1/2, 61/2æ states and of 7Li
in the j1, 1æ state at 834 G. The cloud typically contains N6 5 (5–10) 3 104 atoms
of 6Li in each spin state and N7 5 (3–20) 3 103 atoms of 7Li at a temperature
from T 5 150 nK to 1.3 mK. The 6Li trap frequencies are vz/2p 5 37 Hz, vr/2p
varying from 830 Hz to 2.20 kHz, and the trap depth is 25 mK for our hottest
samples, with T < 2TF. 6Li atoms are imaged in situ using absorption imaging,
while 7Li atoms are imaged after time of flight, providing the temperature in the
same experimental run (Fig. 4). As the scattering length describing the interaction between 7Li and 6Li atoms, a67 5 2 nm, is much smaller than kF{1 , the 7Li
thermometer has no influence on the 6Li density profiles. The 7Li–6Li collision
rate, C67 5 10 s21, is large enough to ensure thermal equilibrium between the
two species.
Full Methods and any associated references are available in the online version of
the paper at www.nature.com/nature.
Received 2 November 2009; accepted 6 January 2010.
1.
Ho, T.-L. Universal thermodynamics of degenerate quantum gases in the unitarity
limit. Phys. Rev. Lett. 92, 090402 (2004).
2. Inguscio, M., Ketterle, W. & Salomon, C. (eds) Proc. Int. School of Physics Enrico
Fermi (Course CLXIV, IOS Press, Amsterdam, 2006).
3. Stewart, J., Gaebler, J., Regal, C. & Jin, D. Potential energy of a 40K Fermi gas in the
BCS-BEC crossover. Phys. Rev. Lett. 97, 220406 (2006).
4. Luo, L., Clancy, B., Joseph, J., Kinast, J. & Thomas, J. Measurement of the entropy
and critical temperature of a strongly interacting Fermi gas. Phys. Rev. Lett. 98,
080402 (2007).
5. Luo, L. & Thomas, J. Thermodynamic measurements in a strongly interacting
Fermi gas. J. Low Temp. Phys. 154, 1–29 (2009).
6. Burovski, E., Prokofev, N., Svistunov, B. & Troyer, M. Critical temperature and
thermodynamics of attractive fermions at unitarity. Phys. Rev. Lett. 96, 160402
(2006).
7. Bulgac, A., Drut, J. & Magierski, P. Spin 1/2 fermions in the unitary regime: a
superfluid of a new type. Phys. Rev. Lett. 96, 090404 (2006).
8. Haussmann, R., Rantner, W., Cerrito, S. & Zwerger, W. Thermodynamics of the
BCS-BEC crossover. Phys. Rev. A 75, 023610 (2007).
9. Combescot, R., Alzetto, F. & Leyronas, X. Particle distribution tail and related
energy formula. Phys. Rev. A 79, 053640 (2009).
10. Lobo, C., Recati, A., Giorgini, S. & Stringari, S. Normal state of a polarized Fermi gas
at unitarity. Phys. Rev. Lett. 97, 200403 (2006).
11. Liu, X., Hu, H. & Drummond, P. Virial expansion for a strongly correlated Fermi
gas. Phys. Rev. Lett. 102, 160401 (2009).
12. Rupak, G. Universality in a 2-component Fermi system at finite temperature. Phys.
Rev. Lett. 98, 090403 (2007).
13. Combescot, R., Recati, A., Lobo, C. & Chevy, F. Normal state of highly polarized
Fermi gases: simple many-body approaches. Phys. Rev. Lett. 98, 180402 (2007).
14. Combescot, R. & Giraud, S. Normal state of highly polarized Fermi gases: full
many-body treatment. Phys. Rev. Lett. 101, 050404 (2008).
15. Prokof’ev, N. & Svistunov, B. Fermi-polaron problem: diagrammatic Monte Carlo
method for divergent sign-alternating series. Phys. Rev. B 77, 020408 (2008).
16. Shin, Y., Zwierlein, M., Schunck, C., Schirotzek, A. & Ketterle, W. Observation of
phase separation in a strongly interacting imbalanced Fermi gas. Phys. Rev. Lett.
97, 030401 (2006).
17. Partridge, G., Li, W., Kamar, R., Liao, Y. & Hulet, R. Pairing and phase separation in
a polarized Fermi gas. Science 311, 503–505 (2006).
18. Nascimbene, S. et al. Collective oscillations of an imbalanced Fermi gas: axial
compression modes and polaron effective mass. Phys. Rev. Lett. 103, 170402 (2009).
19. Shin, Y., Schunck, C., Schirotzek, A. & Ketterle, W. Phase diagram of a twocomponent Fermi gas with resonant interactions. Nature 451, 689–693 (2008).
20. Shin, Y. Determination of the equation of state of a polarized Fermi gas at
unitarity. Phys. Rev. A 77, 041603 (2008).
21. Chevy, F. Universal phase diagram of a strongly interacting Fermi gas with
unbalanced spin populations. Phys. Rev. A 74, 063628 (2006).
22. Schirotzek, A., Wu, C.-H., Sommer, A. & Zwierlein, M. W. Observation of Fermi
polarons in a tunable Fermi liquid of ultracold atoms. Phys. Rev. Lett. 102, 230402
(2009).
23. Ho, T.-L. & Zhou, Q. Obtaining phase diagram and thermodynamic quantities of
bulk systems from the densities of trapped gases. Nature Phys. 6, 131–134 (2010).
24. Spiegelhalder, F. et al. Collisional stability of 40K immersed in a strongly
interacting Fermi gas of 6Li. Phys. Rev. Lett. 103, 223203 (2009).
25. Ho, T.-L. & Mueller, E. High temperature expansion applied to fermions near
Feshbach resonance. Phys. Rev. Lett. 92, 160404 (2004).
26. Chen, Q., Stajic, J., Tan, S. & Levin, K. BCS BEC crossover: from high temperature
superconductors to ultracold superfluids. Phys. Rep. 412, 1–88 (2005).
27. Carlson, J., Chang, S., Pandharipande, V. & Schmidt, K. Superfluid Fermi gases
with large scattering length. Phys. Rev. Lett. 91, 050401 (2003).
28. Bulgac, A., Drut, J. & Magierski, P. Quantum Monte Carlo simulations of the BCSBEC crossover at finite temperature. Phys. Rev. A 78, 023625 (2008).
29. Gubbels, K. & Stoof, H. Renormalization group theory for the imbalanced Fermi
gas. Phys. Rev. Lett. 100, 140407 (2008).
30. Riedl, S., Guajardo, E., Kohstall, C., Denschlag, J. & Grimm, R. Superfluid quenching
of the moment of inertia in a strongly interacting Fermi gas. Preprint at Æhttp://
arXiv.org/abs/0907.3814æ (2009).
31. Greiner, M., Regal, C. & Jin, D. Emergence of a molecular Bose-Einstein
condensate from a Fermi gas. Nature 426, 537–540 (2003).
32. Inada, Y. et al. Critical temperature and condensate fraction of a fermion pair
condensate. Phys. Rev. Lett. 101, 180406 (2008).
33. Pilati, S. & Giorgini, S. Phase separation in a polarized Fermi gas at zero
temperature. Phys. Rev. Lett. 100, 030401 (2008).
34. Horikoshi, M., Nakajima, S., Ueda, M. & Mukaiyama, T. Measurement of universal
thermodynamic functions for a unitary Fermi gas. Science 327, 442–445 (2010).
Supplementary Information is linked to the online version of the paper at
www.nature.com/nature.
Acknowledgements We are grateful to R. Combescot, X. Leyronas, Y. Castin,
A. Recati, S. Stringari, S. Giorgini, M. Zwierlein and T. Giamarchi for discussions and
to C. Cohen-Tannoudji, J. Dalibard, F. Gerbier and G. Shlyapnikov for critical
reading of the manuscript. We acknowledge support from ESF (Euroquam),
SCALA, ANR FABIOLA, Région Ile de France (IFRAF), ERC and Institut Universitaire
de France.
Author Contributions S.N. and N.N. contributed equally to this work. S.N., N.N. and
K.J.J. took the experimental data, and all authors contributed to the data analysis
and writing of the manuscript.
Author Information Reprints and permissions information is available at
www.nature.com/reprints. The authors declare no competing financial interests.
Correspondence and requests for materials should be addressed to S.N.
(sylvain.nascimbene@ens.fr).
1060
©2010 Macmillan Publishers Limited. All rights reserved
doi:10.1038/nature08814
METHODS
Construction of the EOS by successive patches. A typical image at high temperature provides about 100 pixels corresponding to f values varying from 2 at the
trap centre to 6 at the edges, with a signal-to-noise from 3 to 10. Seven such images
are fitted in the wings using the second-order virial expansion and averaged to
obtain a low-noise EOS up to f 5 2. Then images of clouds where the evaporation
has been pushed to a slightly lower temperature are recorded. They show about 75%
overlap in f with the previous EOS. After minimization of the distance between a
new image and the previously determined EOS in the overlap region, we obtain the
value of m0 for a single image with 3% statistical uncertainty. This process is repeated
for six successive trap depths. When averaging one image withtypically
10 previous
pffiffiffiffiffi
images, we obtain a new EOS with an error on f of about 0:03 p
10ffiffiffiffiffi
<1%. The EOS
experiences a random walk error on the 40 images of 0:01| 40<5% for the
coldest data. An independent check of the maximum error is provided by the good
agreement with the superfluid EOS for temperatures lower than Tc (refs 7, 8).
Evaluation of the systematic uncertainties. For the measurement of h(1, f), the
combined uncertainties on the radial frequency of the trap, trap anharmonicity,
magnification of our imaging system, and atom counting affect the pressure
measurement given in equation (3) at ,20% level. However, two measurements,
one at relatively high temperature and one at very low temperature, enable us to
show that the overall error does not exceed 6%. In the temperature range f . 0.5,
the agreement between the experimental value b3 5 20.35(2) and the theoretical
value b3 5 20.355 of the third virial coefficient indicates that the global systematic error is smaller than 6%. Second, at very low temperature, theory7,8 predicts
that the variation of P/2P1 as a function of kBT/m in the superfluid phase remains
smaller than 5%. Our value of P/2P1 5 3.75 below the critical point is within 5%
~3:7ð2Þ. This confirms that systematic errors for
of the T 5 0 prediction j{3=2
s
our coldest samples are also smaller than 6%.
For the determination of the critical transition to superfluidity we fit the lowtemperature data P(m, T)/2P1(m, 0) with a variable horizontal line for T , Tc and
with the Fermi-liquid equation (4) for T . Tc. The result of the fit is the dashed
black line in Fig. 3c, which intersects equation (4) at (kBT/m)c 5 0.315(8). This
statistical error is negligible compared to the error induced by the 6% systematic
uncertainty discussed above, justifying our very simplified fit procedure. Indeed
a 6% error on the pressure induces a 10% error on m for images recorded in the
vicinity of the critical temperature, leading to (kBT/m)c 5 0.32(3).
For the measurement of h(g, 0), the fit of the fully polarized wings of the cloud
serves as a pressure calibration for the rest of the cloud, cancelling many systematic
effects.
In order to estimate temperature effects in the polarized gas, let us first remark
that in the superfluid phase corrections scale as T4 for the bosonic excitations and
are exponentially suppressed by the gap for the fermionic ones7. So in our
temperature range kB T ~0:03m01 their contributions will be very small. On the
other hand, in the partially polarized normal phase, we expect a typical Fermi
liquid T2 scaling. In order to obtain an estimate of the error on the EOS, we
develop the following simple model. In equation (6) which describes a mixture of
zero-temperature ideal gases, we replace the Fermi pressures by the finitetemperature pressures of ideal gases (see equation (1)):
3=2
mp
P ðm1 , m2 , T Þ~P1 ðm1 , T Þz
P1 ðm2 {Am1 , T Þ
m
and run the analysis described in the main text. At T ~0:05m01 , the correction on
h is less than 1%, half of our current error bar.
Limit of 7Li thermometry. As the scattering length between the 7Li atoms,
a77 5 23 nm is negative, the 7Li cloud becomes unstable when a BEC forms.
This occurs at T < 150 nK with typically 3,500 atoms. Precise thermometry with
lower atom numbers becomes difficult. For the measurement of the zerotemperature EOS of the imbalanced gas, we do not use 7Li thermometry but
rather the fit of the wings of the majority spin component.
©2010 Macmillan Publishers Limited. All rights reserved


