Emerging Contaminants and Impaired Waters/TMDLs
advertisement
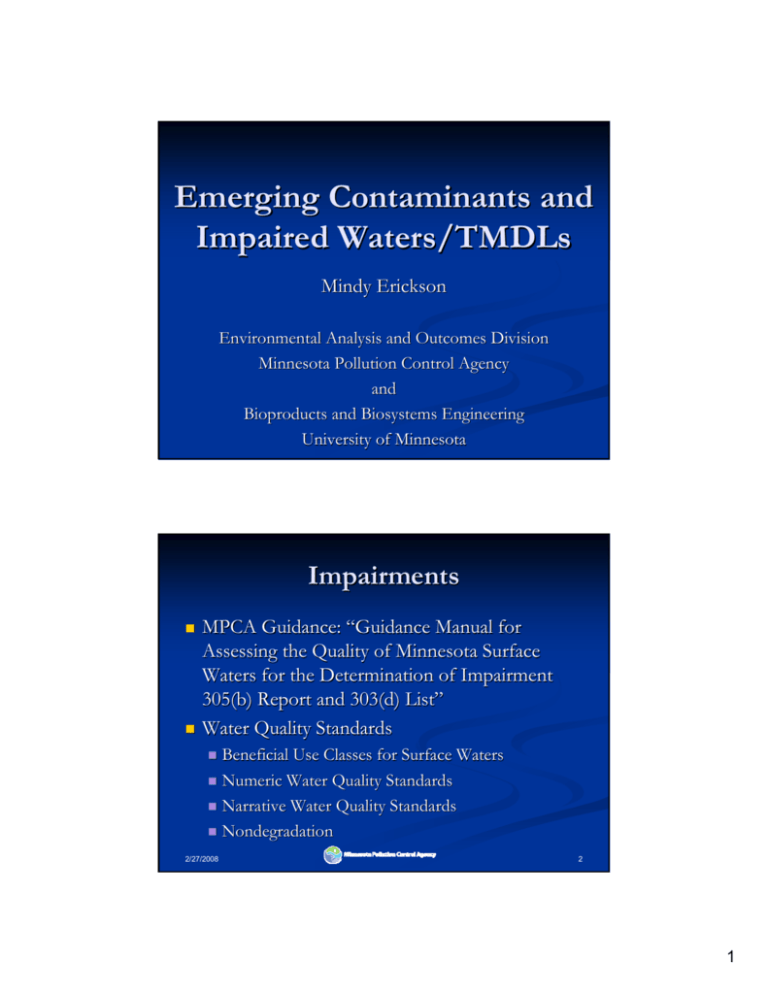
Emerging Contaminants and Impaired Waters/TMDLs Mindy Erickson Environmental Analysis and Outcomes Division Minnesota Pollution Control Agency and Bioproducts and Biosystems Engineering University of Minnesota Impairments MPCA Guidance: “Guidance Manual for Assessing the Quality of Minnesota Surface Waters for the Determination of Impairment 305(b) Report and 303(d) List” Water Quality Standards Beneficial Use Classes for Surface Waters Numeric Water Quality Standards Narrative Water Quality Standards Nondegradation 2/27/2008 2 1 Narrative Water Quality Standards IX.A – Lake eutrophication IX.B – Impairment of the biological community IX.C – Contaminants Introduction and fish consumption advice Basis for assessment of fish contaminants – narrative standards MDH thresholds for consumption advice Selection of single fish mealmeal-perper-week impairment threshold Mercury Polychlorinated biphenyls Data requirements and determination of impaired condition 3 2/27/2008 IX.C.1 – Introduction Two separate beneficial uses: aquatic community healthy, diverse and successfully reproducing fish and other aquatic organisms safe for people and wildlife to eat Impairment possible for one but not the other 2/27/2008 4 2 IX.C.2 – Basis MN Rules 7050.0150, subp. 6 … A water body will be considered impaired when the recommended consumption frequency is less than one meal per week… … not considered impaired if the recommended consumption frequency is one meal per week, or any less restrictive… 5 2/27/2008 IX.C.3 – Thresholds Toxicity Reference dose: units of daily dose, is an estimate of the daily exposure to human populations, including sensitive subsubpopulations, that is likely to be without appreciable risk of deleterious effects over a lifetime. Cancer potency slope: upper 95th percentile confidence limit of the slope from a linear nonthreshold model of incremental cancer risk, expressed in days times kilogram body weight per milligram of toxicant. Exposure 2/27/2008 Sources of toxicants to humans 6 3 IX.C.3 – Thresholds (con’t) Chemical Unlimited 1 meal/ week 1 meal/ month Do not eat Mercury < 0.05 ppm 0.05 – 0.3 ppm 0.2 – 1.0 ppm >1.0 ppm PCBs <0.05 ppm 0.05 – 0.2 ppm 0.2 – 1.0 ppm >1.9 ppm PFOS <38 ng/g 38 – 160 ng/g 161 – 700 >700 ng/g ng/g 2/27/2008 7 IX.C.4 – Impairment Threshold One meal per week 30 g/day Æ about ½ pound per week Site-specific advice can vary 2/27/2008 8 4 IX.C.3 – Data Requirements Fish collected after 1989 Fillet Minimum 5 fish per species 90th percentile exceeds threshold 2/27/2008 9 Fish contaminant monitoring program Multi-agency program MPCA MDH MDNR MDH fish consumption advisory MPCA site-specific study development 2/27/2008 10 5 Lake selection MDNR conducting fish population surveys Fishing pressure high Previous data more than ten years old Information needed for special studies or trend analysis 11 2/27/2008 Differences How does assessment based on a narrative standard differ from… Numeric Standards for Protection of Aquatic Life? Numeric Standard for Protection of Recreation? 2/27/2008 12 6 Emerging Issue Example Perfluorochemicals (PFCs) Mindy Erickson Laura Solem Mark Ferrey Paul Hoff 2/27/2008 14 7 PFCs Surfactants with unique chemical properties Used for many years in products that resist heat, stains, water, oil and grease Many specialized industrial and commercial uses 15 2/27/2008 Some Commercial Uses of PFOS Fabric coatings Carpet coatings Paper coatings Floor polish Alkaline cleaners Denture cleaners Shampoos Fire-fighting foam Aviation hydraulic fluid Mining/oil well surfactant Acid rust suppressant Metal plating Electronic etching bath Pesticides - U.S. Environmental Protection Agency 2/27/2008 16 8 Background PFCs of concern because: Widely used Persistent Soluble 1,000 ppm PFOA; 550 ppm PFOS Low adsorption, readily desorb Atmospheric transport/deposition Exposure and health concerns PFOS – liver and thyroid impairments: animal studies PFOA – liver, immune and developmental impairments: animal studies PFBA – longlong-term effects not yet studied. Potentially less toxic, but more mobile 17 2/27/2008 Emerging Issues Barriers Laboratory methods Toxicology research Regulatory framework Standards Knowledge of sources 2/27/2008 18 9 Rapid evolution In 2005… HBV for PFOS: 1 μg/L HBV for PFOA: 7 μg/L Lab detection level for PFOA: 1.0 μg/L Lab detection level for PFOS: 0.5 μg/L In 2007… HRL for both PFOA and PFOA: 0.3 μg/L MDH lab report levels: 0.3 ppb flag and report estimated concentrations to 0.05 ppb Axys lab reporting levels approximately 0.01 ppb 2/27/2008 19 PFC Source Investigation Activities Sampling Ground water Soil Sediment Effluent Leachate Drinking water Literature review Fate and transport Toxicology 2/27/2008 20 10 2/27/2008 21 2/27/2008 22 11 23 2/27/2008 Lake Calhoun Fish - 2007 2/27/2008 24 12 Ambient Ground Water No PFCs detected in 2006 Relatively high detection level Recommended additional sampling with lower detection level 2/27/2008 25 Some of MPCA’s current studies Ambient ground water monitoring, urban and agricultural areas Ambient surface water: Mississippi River basin, urban and agricultural areas Air and precipitation monitoring Data management and public access to data Fish tissue monitoring, urban and rural areas Food chain/wildlife/ecological risk assessment studies Lake Calhoun PFOS Source Investigation Literature review: fate & transport, toxicology, risk assessment, assessment, standardstandard-setting Soil microcosm studies with EPA labs Waste water treatment plant PFC assessment Water quality criteria development for PFBA Fire fighting foam survey 2/27/2008 26 13 PFCs General Form CF3(CF2)nCF2-R PFC Chemical Structures Perfluoroalkyl Sulfonic acids PFAS Perfluoroalkyl Carboxylic acids PFCA Fluorotelomer Alcohols FTOH Perfluoroalkyl Phosphates PAPs 2/27/2008 28 14 PFCs currently analyzed Perfluoroalkyl sulfonates and sulfonamide: Perfluorobutane sulfonate Perfluorohexane sulfonate Perfluorooctane sulfonate Perfluorooctane sulfonamide Perfluoroalkyl carboxylic acids: Perfluorobutanoic acid Perfluoropentanoic acid Perfluorohexanoic acid Perfluoroheptanoic acid Perfluorooctanoic acid Perfluorononanoic acid Perfluorodecanoic acid Perfluoroundecanoic acid Perfluorododecanoic acid 29 2/27/2008 PFCs of most interest in MN PFOS: C8F17SO3Perfluorooctane sulfonate and its salts PFOA: C8F15O2Perfluorooctanoic acid and its salts PFBA: C4F7O2Perfluorobutanoic acid and its salts 2/27/2008 30 15 General PFC Pathways Inhalation PFCs in atmosphere Ingestion, Dermal Contact, Inhalation Product Use (fire fighting foam, fabric protectors, cookware, shampoo) Fish Consumption Disposal of Products, Wastes Manufacturing Aquatic Systems, (including wastewater treatment, landfills) Occupational exposure Fish Stormwater runoff Ingestion Drinking water ingestion Ground water contamination Soil deposition/ land application Ag Food Products Ingestion Sampled Media Ground water Surface water Waste water treatment plant Influent Effluent Sludge Fish 2/27/2008 32 16 Ambient ground water Monitoring wells because… shallower depths to water shorter screen lengths 17 urban wells 9 in Twin Cities area 8 outstate 17 agricultural locations (MDA) 15 monitoring wells 3 springs 2/27/2008 33 2/27/2008 34 17 2/27/2008 35 2/27/2008 36 18 37 2/27/2008 Surface Water Rivers St. Croix River near Wild River State Park Mississippi River Pool 3 Lakes Calhoun (Hennepin) Tettegouche (Lake) Dyers (Cook) Long (Kandiyohi) Sagatagan (Sterns) Long (Itasca) 2/27/2008 38 19 Waste Water Treatment Plant Grab samples from 28 WWTPs across Minnesota variety of municipal and industrial facilities influent, effluent, sludge 39 2/27/2008 Fish Lake selection higher fishing pressure prevalence of bluegill and bass Pan fish Game fish bluegill, black crappie, yellow perch largemouth bass, northern pike, walleye 33 urban lakes 60 outstate lakes (results not yet available) 2/27/2008 40 20 Ground water sampling Peristaltic pump, polyethylene tubing, and silicone tubing Field measurements No teflon bailers or tubing pH, DO, temperature, conductivity, redox Field analyses Alkalinity, chloride, iron, nitrate 41 2/27/2008 All sampling Sampler avoided personal contact with potential PFC sources Lab cleaned and proofed polypropylene bottles Bottles sealed individually, stored 4º C PFC-free blue ice for shipping Dry ice for shipping fish 2/27/2008 42 21 QA/QC Avoid contamination from PFC-containing materials: Use nitrile gloves Wear old clothing (laundered at least six times) Avoid prepre-wrapped food and snacks (candy bars, chips) Avoid fast food wrappers Avoid wearing water resistant clothing Avoid wearing insect repellant/sunscreen New tubing for each ground water sample Ten percent blind duplicate samples Blind equipment blank using PFC-free water provide by lab Reporting Level (RL) of 25 nanograms per liter (ng/L) 43 2/27/2008 Laboratory AXYS Analytical Services Ltd. AXYS Method MLA-060 Analytical Procedure for the Analysis of Perfluorinated Organic Compounds in Aqueous Samples by LC-MSIMS No EPA-approved method for PFCs at this time 2/27/2008 44 22 Urban Ground Water Results PFC detections at 9 of the 17 sample locations PFBA most commonly detected 7 of 17 sample locations above RL Twin Cities Metro Area Industrial or sewered residential land use Concentrations 43.4 – 922 ng/L 2/27/2008 45 2/27/2008 46 23 Agricultural Area Ground Water Results PFBA only detected PFC PFBA detected above reporting level 25 ng/L at two locations Highest concentration 63 ng/L 2/27/2008 47 2/27/2008 48 24 Surface Water Results Water Body St. Croix River PFBA 4.57 PFOA PFOS ND ND Mississippi River, Pool 3 383.7 30.4 26.6 Calhoun (Hennepin) 25.4 19.8 108.0 Tettegouche (Lake) Dyers (Cook) Long Lake (Kandiyohi) Sagatagan (Sterns) ND 1.42 ND ND ND ND 10.3 11.7 ND ND 1.85 ND Long Lake (Itasca) 11.3 0.988 ND 49 2/27/2008 WWTP Effluent Results PFOS detected in 12 of 28 effluent samples PFOS, PFOA, PFBS and PFHxS most commonly detected PFOS concentration range 7 – 1,510 ng/L Highest concentrations at Brainerd WWTP Traced to a specific industrial source 2/27/2008 50 25 Urban Fish Tissue Results 4 of 31 lakes with fish fillet PFOS concentration ≥160 ng/g (at least one species) 13 of 31 lakes with PFOS 38 – 160 ng/g 14 of 31 lakes with PFOS <38 ng/g Awaiting results for fish from 2 lakes MDH will consider results during its fish consumption advisory update 2/27/2008 51 2/27/2008 52 26 Discussion Ground water: highest ground water PFBA concentrations in… Twin Cities area Industrial, commercial, and sewered residential Surface water: Higher PFC concentrations in urban lakes PFC distribution and ratios different urban vs. rural Fish tissue: highest PFOS in… Lakes in the urban core (outstate lakes not yet known) No specific PFOS sources identified 53 2/27/2008 Other MPCA studies PFCs present in… Landfill leachate and landfill gas condensate Ground water upgradient and downgradient of landfills Waste water treatment plant influent, effluent, and sludge Urban storm water runoff Air 2/27/2008 54 27 Additional Information Half-life of PFOA and PFOS in humans is more than four years Half-life of PFBA is a few days MDH drinking water standard for PFOS and PFOA: 0.3 ug/L PFBA standard is currently being developed National biomonitoring: low concentrations of PFCs ubiquitous in human blood Some PFCs undergoing ‘voluntary phase-out’ Some PFC uses will be exempt from the phase-out 55 2/27/2008 Summary PFCs present in general consumer and industrial waste PFCs partition to water and air PFOS bioaccumulates in fish PFC sources, transport, and fate complex 2/27/2008 56 28 Barriers Laboratory methods Toxicology research Advancing, NPDES and landfill programs evaluating Standards Advancing, new papers almost weekly Regulatory framework Advancing, still no EPA approved method Advancing, PFOS and PFOA WQS and HRLs, PFBA in process Knowledge of sources Advancing slowly, proprietary information barriers 57 2/27/2008 Now what? TMDL development for PFC-impaired waters Conduct further monitoring and study Complete pollutant load formula allocation Develop restoration strategy Implement restoration strategy Monitor changes 2/27/2008 58 29 Further monitoring/study Food chain studies Lake Calhoun PFOS source study Stormwater Precipitation Land use Fire station survey WWTP studies 59 2/27/2008 Pollutant Load Formula LA(s) + WLA(s) + Margin of Safety + Reserve Capacity = Total Pollution Maximum Daily Load Where: LA = Load allocations from nonpoint sources WLA = Waste load allocations from point sources Margin of Safety = to account for potential scientific error Reserve capacity = set aside for future development 2/27/2008 60 30 Develop and Implement Restoration Strategy? Monitor Change? 31 For more information Mindy Erickson Mindy.Erickson@state.mn.us or 651-297-8383 Laura.Solem@state.mn.us or 218-529-6254 Other PFC team members: http://www.mail.state.mn.us/ http://www.pca.state.mn.us/hot/pfc.html http://www.health.state.mn.us/divs/eh/hazardous/t opics/pfcshealth.html http://www.epa.gov/opptintr/pfoa/index.htm http://www.pca.state.mn.us/water/tmdl/index.html 63 2/27/2008 Questions? 32

![This article was downloaded by: [Canadian Research Knowledge Network] On: 8 May 2011](http://s2.studylib.net/store/data/012071041_1-9f45b45184576bf1b4e3a51d7bbdff6e-300x300.png)
