Understanding a Change in Supply vs. a Change in Quantity
Supplied
Ä
Ä
Ä
A supply curve is a collection of points representing the quantity of a good
that a supplier is willing and able to offer for sale in a given period of time,
as a function of the good’s price.
A change in quantity supplied is shown as a movement along a supply
curve and is a function of price.
A change in supply is shown as a shift in the supply curve and is a
function of a change in any of the supply variables except price.
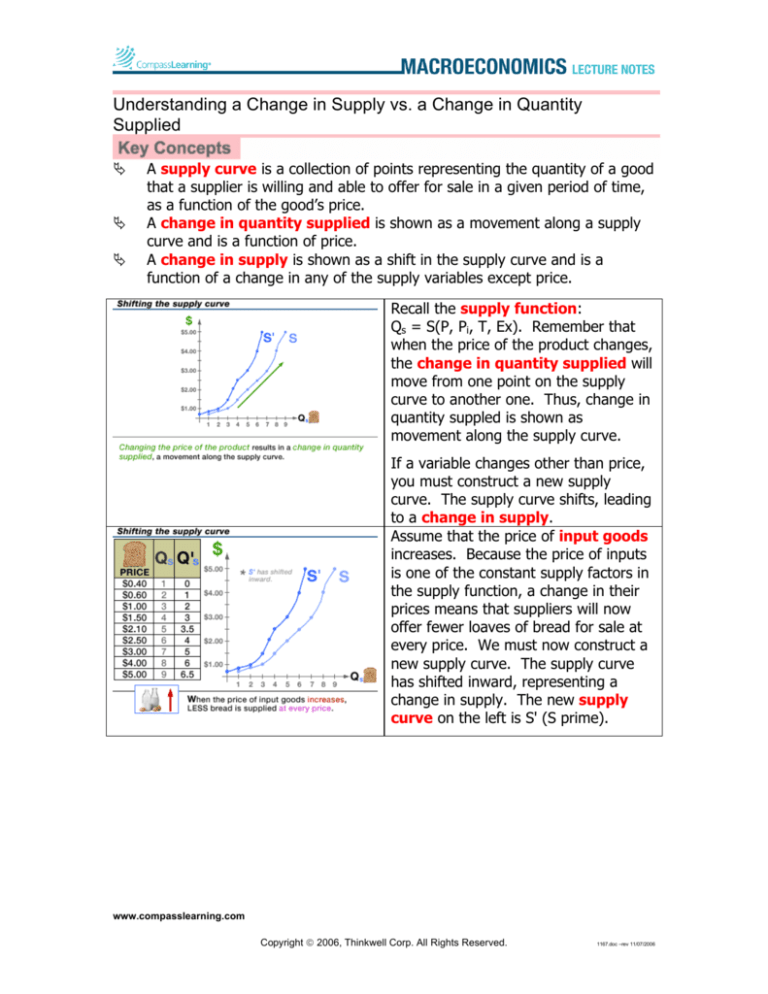
Recall the supply function:
Qs = S(P, Pi, T, Ex). Remember that
when the price of the product changes,
the change in quantity supplied will
move from one point on the supply
curve to another one. Thus, change in
quantity suppled is shown as
movement along the supply curve.
If a variable changes other than price,
you must construct a new supply
curve. The supply curve shifts, leading
to a change in supply.
Assume that the price of input goods
increases. Because the price of inputs
is one of the constant supply factors in
the supply function, a change in their
prices means that suppliers will now
offer fewer loaves of bread for sale at
every price. We must now construct a
new supply curve. The supply curve
has shifted inward, representing a
change in supply. The new supply
curve on the left is S' (S prime).
www.compasslearning.com
Copyright ã 2006, Thinkwell Corp. All Rights Reserved.
1167.doc –rev 11/07/2006


