The data warehouse architecture
advertisement
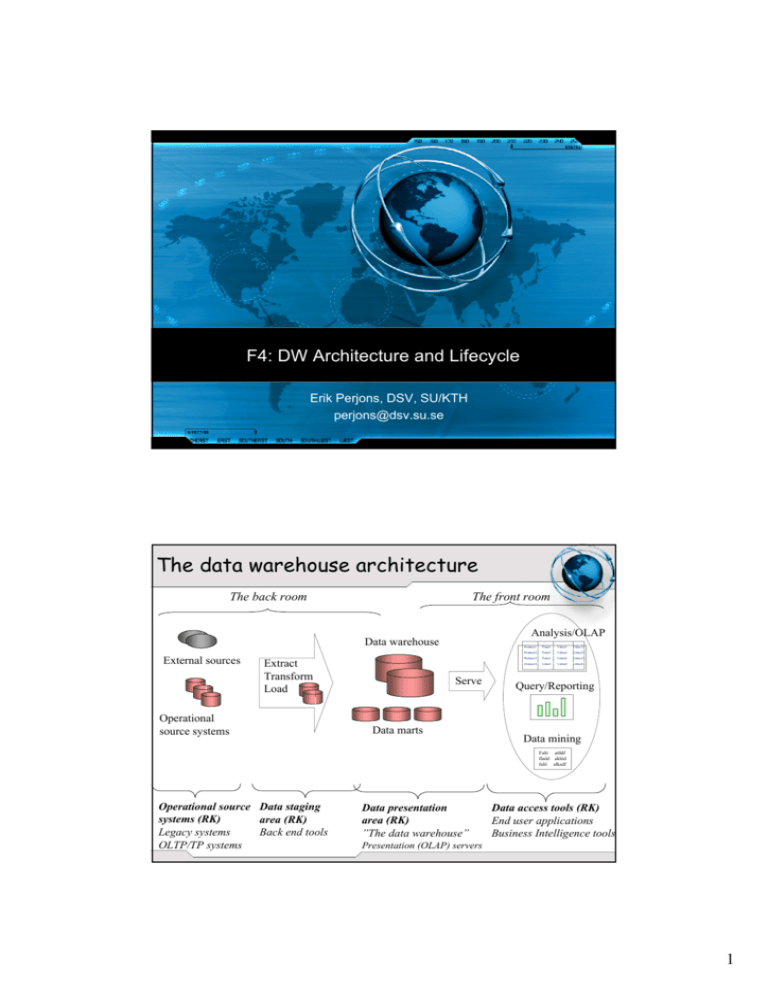
F4: DW Architecture and Lifecycle Erik Perjons, DSV, SU/KTH perjons@dsv.su.se The data warehouse architecture The back room The front room Analysis/OLAP Data warehouse External sources Extract Transform Load Operational source systems Serve Data marts Productt Time1 Value1 Value11 Product2 Time2 Value2 Value21 Product3 Time3 Value3 Value31 Product4 Time4 Value4 Value41 Query/Reporting Data mining Falö aöldf flaöd aklöd falö alksdf Operational source Data staging systems (RK) area (RK) Legacy systems Back end tools OLTP/TP systems Data presentation area (RK) ”The data warehouse” Data access tools (RK) End user applications Business Intelligence tools Presentation (OLAP) servers 1 Operational Source Systems Operational source systems characteristics: Operational source systems • the source data often in OLTP (Online Transaction Processing) systems, also called TPS (Transaction Processing Systems) • high level of performance and availability • often one-record-at-a time queries • already occupied by the normal operations of the organisation OLTP vs. DSS (Decision Support Systems) OLTP vs. OLAP (Online analytical processing) Operational Source Systems More operational source systems characteristics: Operational source systems • a OLTP system may be reliable and consistent, but there are often inconsistencies between different OLTP systems • different types of data format and data structures in different OLTP systems AND DIFFERENT SEMANTICS 2 Operational Source Systems Kimball et al´s assumptions (p 7): Operational source systems •Source systems are not queried in the broad and unexpected ways •Maintain little historical data •Each source systems is often a natural stovepipe application DW architecture: Data staging area Analysis/OLAP Data warehouse External sources Operational source systems Extract Transform Load Serve Data marts Productt Time1 Value1 Value11 Product2 Time2 Value2 Value21 Product3 Time3 Value3 Value31 Product4 Time4 Value4 Value41 Query/Reporting Data mining Falö aöldf flaöd aklöd falö alksdf Operational source systems Data staging area Data presentation area Data access tools 3 The Data Staging Area Often the most complex part in the architecture, and involves... • • • • Extract Transform Load Extraction (E) Transformation (T) Load (L) indexing ETL-tools can be used Scripts for extraction, transformation and load are implemented Data staging area Extract Transform Load Extraction means reading and understanding the source data and copying the data needed for the data warehouse into staging area for further manipulation, i.e. transformation 4 Data staging area Transformation involves… Extract Transform Load • data conversion/transformation (specify transformation rules to convert to a common data format and common terms/semantics) • data cleaning/cleansing – data scrubbing (use domain-specific knowledge (e.g postal adresses) to check the data) – data auditing (discover suspicious pattern, discover violation of stated rules) • combining data from multiple sources • assigning warehouse (surrogate) keys • data aggregation Data staging area A debate questions: Extract Transform Load Should the data in the data staging area be stored in a 3NF relational database and loaded into the presentation area for querying and reporting? Kimball (p 8-9): a 3NF relational database in data staging area requires more time and resources for development, periodic loading and updating and more capacity of storing the multiple copies of the data 5 A Real World Example Flat file C DB2Connect DB2 table(s) D’ Various source files Customer data F Customer data G Start balance H Fees (manually adjusted to individual agreements) I Staging area for checking, analysing, cleaning, complementing etc transaction data Three star/join schemas comprising altogether 8 tables Fact tables: - transactions (10 attributes) - fees (7 attributes) - start balance (4 attributes) Dimensional tables: - time (7 attr) - customer (> 40 attr) - company (> 90 attr) - product (13 attr) - ”Service charged” (2 attr) SQL, C++ ?? Some cleansing and scrubbing may be needed here DB2 Preliminary target DW E +aggregation (new program) DB2 Final target DW E’ E complemented with some aggregated tables DW architecture: Data presentation area Analysis/OLAP Data warehouse External sources Operational source systems Extract Transform Load Serve Data marts Productt Time1 Value1 Value11 Product2 Time2 Value2 Value21 Product3 Time3 Value3 Value31 Product4 Time4 Value4 Value41 Query/Reporting Data mining Falö aöldf flaöd aklöd falö alksdf Operational source systems Data staging area Data presentation area Data access tools 6 Data presentation area Data warehouse OLAP servers Data marts • • • • What is OLAP? Dimensional modelling vs. 3 NF modelling Data Marts ROLAP/MOLAP servers What is OLAP? • Acronym for “On-line analytical processing” • A decision support system (DSS) that support ad-hoc querying, i.e. enables managers and analysts to interactively manipulate data. The idea is to allow the users to easy and quickly manipulate and visualise the data through multidimensional views, i.e. different perspectives. Service quarter e fic of Quarter Facts Office product Kimball: Dimensional modelling 7 Dimensional modelling Service Dimension Service Key Service group S1 Local call Group A S2 Intern. call Group A S3 SMS Group B S4 WAP Group C 1 0..* Time Dimension Date/ Key 991011 991012 C210 C210 C212 C213 C214 S1 S3 S2 S1 S4 F11 F11 F13 F13 F13 991011 991011 991011 991011 991012 0..* Office Sundsvall Sundsvall Kista 1 Year 99 99 Number of calls 3 1 1 1 1 0..* Customer Dimension Sales Dimension Seller Anders C Lisa B Janis B Sum 25:00 05:00 89:00 12:00 08:00 Quarter 4 - 99 4 - 99 1 Fact table - Transactions 0..* Key F11 F12 F13 Month 9910 9910 Key C210 C211 C212 C213 C214 1 Customer Anna N Lars S Erik P Danny B Åsa S Address Stockholm Malmö Rättvik Stockholm Stockholm Region Stockholm Skåne Dalarna Stockholm Stockholm Income group B B C A A Dimensional modelling Service Dimension Service Key Service group S1 Local call Group A S2 Intern. call Group A S3 SMS Group B S4 WAP Group C Time Dimension Date/ Key 991011 991012 S1 S3 S2 S1 S4 F11 F11 F13 F13 F13 991011 991011 991011 991011 991012 Sum 25:00 05:00 89:00 12:00 08:00 Number of calls 3 1 1 1 1 Σ=37:00 Key F11 F12 F13 Seller Anders C Lisa B Janis B Office Sundsvall Sundsvall Kista Quarter 4 - 99 4 - 99 Year 99 99 Fact table - Transactions C210 C210 C212 C213 C214 Sales Dimension Month 9910 9910 Query: For how much did customers in Sthlm use service “Local call” in october 1999? Customer Dimension Key C210 C211 C212 C213 C214 Customer Anna N Lars S Erik P Danny B Åsa S Address Stockholm Malmö Rättvik Stockholm Stockholm Region Stockholm Skåne Dalarna Stockholm Stockholm Income group B B C A A 8 3 NF modelling vs. Dimensional modelling Key difference between 3NF and Dimensional modelling: - the degree of normalisation 3 NF modelling - a logical design technique to eliminate data redundancy to keep consistency and storage efficiency, and makes transaction simple and deterministic - ER models for enterprise are usually complex, e.g. they often have hundreds, or even thousands, of entities/tables Dimensional modelling - a logical design technique that present data in a intuitive, i.e. easier to navigate for the user - allow high performance access/queries (the complexity of 3NF models overwhelms the database systems optimizer, which means bad performance) [Kimball et al, p 10-11] - aims at model decision support data Data presentation area – Data marts Kimball et al (p.10-12 and 396) “we refer to the presentation area as a series of integrated data marts” “a data mart is a flexible set of data, ideally based on the most atomic (granular) data possible to extract from operational source, and presented in a symmetric (dimensional) model that is resilient when faced with unexpected user queries” “in its most simplistic form a data mart represent data from a single business process” (business process=purchase order, store inventory and so on) 9 Data marts Service Quarter Calls Service Quarter Office Subscription orders Office Service Quarter Calls Office Subscription orders The data warehouse bus architecture A data mart A data mart Orders ction Produ Dimensions Time Sales Rep Customer Promotion Product Plant Distr. Center [Kimball et al, p 78-79] 10 Data marts • A dimensional model for a large data warehouse consists of between 10 and 25 similar-looking data marts. Each data marts will have 5 to 15 dimensional tables. The Data marts Kimball et al’s strong opinions (p.10-12) • all data in the presentation area should be presented, stored and accesses in dimensional models • the data marts must contain detailed, atomic data (it is unacceptable that the detailed data should be locked up in 3 NF models for drill-down) • the data marts dimensions should be conformed for drill-across techniques, which tie the data marts together in the data warehouse bus architecture 11 The Data marts More about data marts: • far smaller data volumes, fewer data sources • easier data cleaning process, faster roll-out • allows a “piecemeal” approach to some of the enormous integration problems involved in creating an enterprise wide data model, but complex integration in the long term Dependent vs. Independent Data marts Independent Data marts Data warehouse Dependent Data marts Data warehouse 12 The presentation/OLAP servers Extended Relational DBMS (ROLAP servers) – – – – data stored in RDB star-join schemas support SQL extensions index structures Data warehouse OLAP servers Data marts Multidimensional DBMS (MOLAP servers) – – – – data stored in arrays (n-dimensional array) direct access to array data structure excellent indexing properties poor storage utilisation, especially when the data is sparse. More about presentation servers What is characteristics regarding data warehouse, according to Chaudhiri&Dayal : • Index structures (bit map indexes, join indexes) • SQL extensions (operators like Cube, Crossjoin) • Materialised views (pre-aggregations) 13 DW architechture: Metadata repository Monitoring & Administration Metadata repository OLAP servers Data warehouse External sources Operational source systems Extract Transform Load Refresh Serve Analysis Productt Time1 Value1 Value11 Product2 Time2 Value2 Value21 Product3 Time3 Value3 Value31 Product4 Time4 Value4 Value41 Query/Reporting Data mining Data marts Operational source systems Falö aöldf flaöd aklöd falö alksdf Data staging area Data presentation area Data access tools What is metadata? “Data about data”/”Information about data” Main functions are to give... • data definitions • the origin of data • the structure of data • rules for the selection and transfer of data • qualitative and quantitative data about data Contained in metadata repository Æ 14 The metadata repository An integrated complete source of metadata • is at the heart of the data warehouse architecture • supports the information needs of... – system developers – data administrators – system administrators – users – applications on the data warehouse • very complex data structure • must contain full version history • must always be up to date Metadata life cycle activities • Collection • identify and capture metadata in a central repository • Maintenance • establish processes to synchronise metadata with the changing data structure • Deployment • provide metadata to users in the right form and with the right tools 15 Different types of metadata • Administrative metadata (includes all information necessary for setting up and using a DW, e.g. Information about source databases, dw schemas, dimensions, hierachies, predefined queries, physical organisation, rules and script for extraction, transformation and load, back-end and front end tools) • Business metadata (business terms and definitions, ownership of data) • Operational metadata (information collected during the operations of the DW, e. g. usage statistics, error reports) DW architecture: End user applications Monitoring & Administration Metadata repository OLAP servers Data warehouse External sources Operational DBs Extract Transform Load Refresh Serve Analysis Productt Time1 Value1 Value11 Product2 Time2 Value2 Value21 Product3 Time3 Value3 Value31 Product4 Time4 Value4 Value41 Query/Reporting Data mining Data marts Operational source systems Falö aöldf flaöd aklöd falö alksdf Data staging area Data presentation area Data access tools 16 End user applications Analysis Productt Time1 Value1 Value11 Product2 Time2 Value2 Value21 Product3 Time3 Value3 Value31 Product4 Time4 Value4 Value41 Query/Reporting • OLAP tools, BI apps, DSS • Query/Reporting tools • Data mining Data mining Falö aöldf flaöd aklöd falö alksdf Spreadsheet output of OLAP tool product product group mounth quarter Column headers (join constraints) Product Group Group A Group A Group B Group B office region Column header (application constraint) Region ABC XYZ ABC XYZ Answer set representing focal event First Quarter - 1997 1245 34534 45543 34533 Row headers 17 Graphical output of OLAP tool Functionalities of OLAP tools • Drill-down - decreasing the level of aggregation • Drill-up/Roll-up/Consolidation - increasing the level of aggregation • Drill-across - move between different star-join schemas using conformed dimensions and joins • Slicing and dicing – ability to look at the database from different views, e.g. one slice shows all sales of product type within regions, another slice shows all sales by sales channel within each product type • Pivoting - e.g. change columns to rows, rows to columns • Ranking - sorting “Think of an OLAP data structure as a Rubik´s Cube of data that users can twist and twirl in different ways to work through what-if an what-happend scenarios” [Lee Thé] 18 Business Intelligence (BI) apps Strategic Who: strategic leaders What: formulate strategy and monitor corporate performance Examples: Balance scorecard, Strategic Planning Operational Who: operational managers What: execution of strategy againts objectives Examples: Budgeting, Sales forcasting Analytical Who: analysts, knowledge worker, controller What: ad-hoc analysis Examples: Financial and Sales Analysis, Customer Segmentation, Clickstream analysis Problems of Data Warehousing • Complexity of integration – Hidden problems with source systems – Data homogenisation – Underestimation of resources for data loading • Required data not captured • High maintenance • Long duration projects • Why not integrating the legacy applications (OLTP systems) instead? 19 Operational Data Store (ODS) No singel universal defintion... ODS definition 1: Implemented to deliver operational reporting, especially when neither the legacy nor the modern OLTP systems provide adequate operational reports – fixed queries and for tactical decision making ODS definition 2: Built to support real-time interactions, especially in Customer Relationsship Management applications – the tradtional data warehouse typically is not in a position to support the demand for near-real-time data OMG’s standards Meta Object Facility (MOF) M3 layer M2 layer Meta metamodel Metamodel UML Metamodel CWM Metamodel M1 layer M0 layer Model Instances Helen Nagy Invoice no 34 20 Common Warehouse Metamodel (CWM) Data Source Analysis Data Mart Reporting Data Source Operational Data Store ETL Data Warehouse Data Mart Visualization Data Mart Data Mining Data Source The collection of metamodels by CWM can be used to model the whole data warehousing environment i.e from data sources to end use analysis, and data warehouse management Common Warehouse Metamodel • Common Warehouse Metamodel (CWM) is a language specifically design to model data warehousing and data mining applications, i.e. integrating data warehousing and business analysis (business intelligence) tools • CWM has a lot in common with the UML metamodel but has a number of special metamodels (metaclasses), e.g modelling relational databases, multidimensional databases, OLAP, schema transformations, XML [Kleppe et al, p.139-140 (2003)] 21 Why metamodelling? Event consists of Meta metamodel level or Reference model consists of Precedes Transformation State Succedes Precedes/ Succedes Precedes Function State Activity Event Metamodel level Precedes Succedes Succedes Order recieved Model level Capture ordered items Capture ordered items Ordered item [captured] Ordered item captured Check material on stock Check material on stock Material on stock [checked] X Material is not on stock Material is on stock [Rosemann, Green, 2002] CWM packages Management Warehouse Process Analysis Transformation Resource Relational Foundation Object Model Business Information Core Warehouse Operation OLAP Record Data Types Information Visualization Data Mining Expressions Behavioral Business Nomenclature Multi-Dimensional XML Keys and Indexes Type Mapping Relationships Software Deployment Instance Packages/Metamodels 22 CWM packages layers • Object layer - base metamodels/packages, which are (re)used by the other metamodels/packages • Foundation layer - extends the object layer with services required which are (re)used by the other metamodels/packages, e.g “unique key” in the Key Indexes metamodel/package is used by relational databases, OO-databases and record-oriented • Resource layer - defines metamodels/packages for various types of data resouces • Analysis layer - analysis-oriented metadata • Management layer - describing the data warehousing process as a whole [Poole et al, p.36-40 (2002)] CWM packages relations Core package Element ModelElement Namespace re atu rFe Feature sifie Expression s Cla StructuralFeature Classifier ProcedureExpression Class Attribute Relational package Datatype package ColumnSet NamedColumnSet Table Column QueryExpression QueryColumnSet View 23 CWM classifyer equality Object Package Classifier (Klass) Feature (Attribut) Relational Schema Table Column Record Record file RecordDef Field Multi Dimensional Schema Dimenson Dimension ed Objct Element Type Attribute XML Schema More about CWM Tool Y Metamodel Common Representation Tool X Metamodel Tool Z Metamodel <<metamodels>> CWM Packages 24 Business Dimensional Lifecycle Technical Technical Architecture Architecture Design Design Product Product Selection Selection & & Installation Installation Business Business Project Project Planning Planning Requirement Requirement Dimensional Dimensional Modeling Modeling Physical Physical Design Design Data Data Staging Staging Design Design & & Development Development Deployment Deployment Definition Definition End-User End-User Application Application Specification Specification Maintenance Maintenance and and Growth Growth End-User End-User Application Application Development Development Project Project Management Management The Data Warehouse Architecture Framework Level of detail Data ARCHITECTURE AREA Back room Front room Infrastructure Info needed for better decisions Enterprise models How get, transform, make available data Major business issues. How measure How analyse HW/SW capabilities needed vs what we have Architecture models and documents Focal events, facts, dimensions Dimensional models Capabilities needed to get and transform data Major data stores User’s needs Major classes of analyses Priorities Where is data coming from Calc and storage reqs Detailed models and specs Logical and physical models Domains, derivation rules Standards, prods to provide capabilities How hook together Report layouts, derivation For whom, when How interact with capabilities System utilties, calls, APIs ... Implementation DB, indexes backup ... Write extracts, loads Automate process Implement report and analysis env Build rpt Train users Install, test infrastructure. Connect sourcesto targets to desktop Business reqs and audit 25


