An Overview of Microwave Sensor Technology
advertisement
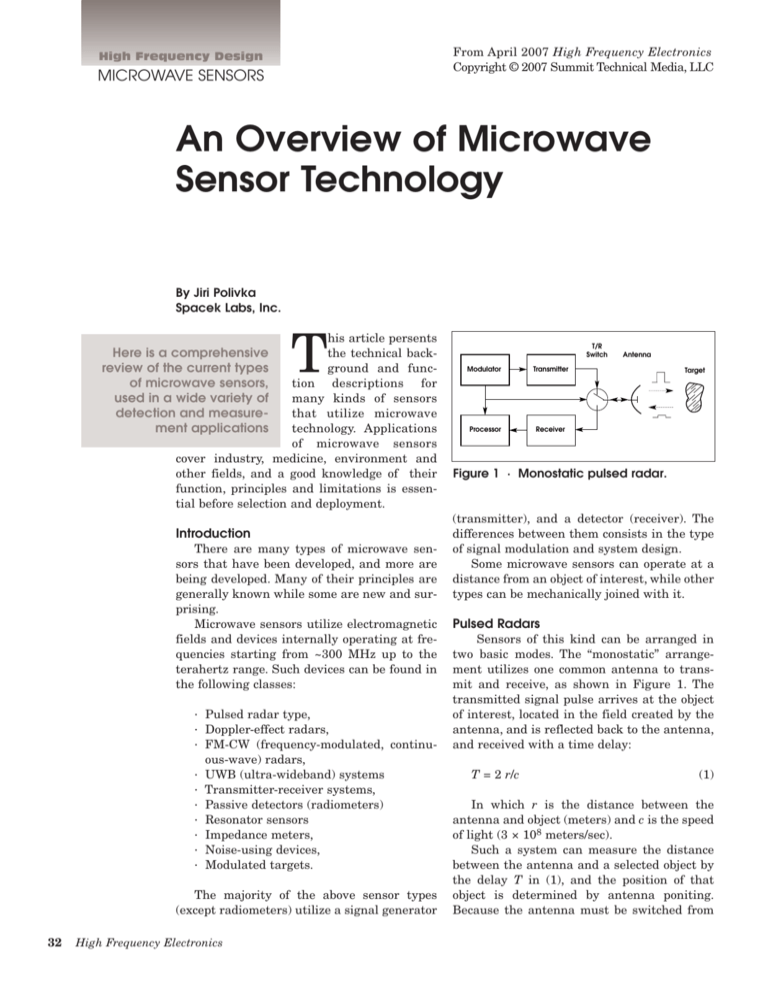
From April 2007 High Frequency Electronics Copyright © 2007 Summit Technical Media, LLC High Frequency Design MICROWAVE SENSORS An Overview of Microwave Sensor Technology By Jiri Polivka Spacek Labs, Inc. T his article persents the technical background and function descriptions for many kinds of sensors that utilize microwave technology. Applications of microwave sensors cover industry, medicine, environment and other fields, and a good knowledge of their function, principles and limitations is essential before selection and deployment. Here is a comprehensive review of the current types of microwave sensors, used in a wide variety of detection and measurement applications Introduction There are many types of microwave sensors that have been developed, and more are being developed. Many of their principles are generally known while some are new and surprising. Microwave sensors utilize electromagnetic fields and devices internally operating at frequencies starting from ~300 MHz up to the terahertz range. Such devices can be found in the following classes: · Pulsed radar type, · Doppler-effect radars, · FM-CW (frequency-modulated, continuous-wave) radars, · UWB (ultra-wideband) systems · Transmitter-receiver systems, · Passive detectors (radiometers) · Resonator sensors · Impedance meters, · Noise-using devices, · Modulated targets. The majority of the above sensor types (except radiometers) utilize a signal generator 32 High Frequency Electronics T/R Switch Modulator Transmitter Processor Receiver Antenna Target Figure 1 · Monostatic pulsed radar. (transmitter), and a detector (receiver). The differences between them consists in the type of signal modulation and system design. Some microwave sensors can operate at a distance from an object of interest, while other types can be mechanically joined with it. Pulsed Radars Sensors of this kind can be arranged in two basic modes. The “monostatic” arrangement utilizes one common antenna to transmit and receive, as shown in Figure 1. The transmitted signal pulse arrives at the object of interest, located in the field created by the antenna, and is reflected back to the antenna, and received with a time delay: T = 2 r/c (1) In which r is the distance between the antenna and object (meters) and c is the speed of light (3 × 10⁸ meters/sec). Such a system can measure the distance between the antenna and a selected object by the delay T in (1), and the position of that object is determined by antenna poniting. Because the antenna must be switched from High Frequency Design MICROWAVE SENSORS Illuminating Antenna Modulator Circulator Antenna Transmitter Transmitter Target Moving Target Coupler Frequency Counter Receiver Processor Receiver Search Antenna Figure 3 · Doppler Effect sensor. Figure 2 · Bistatic (pulsed) radar. VoltageTuned Osc. Power Divider Circulator Antenna Target Vehicle Sweep Voltage Video Output to Signal Processor LO IF Video Amplifier RF Mixer Figure 4 · Anti-collision radar mm-wave module configuration. the transmitter to the receiver, and very fast, it is difficult to detect objects (“targets”) which are located close to the antenna. For such cases, the probing pulse must be much shorter than T, as well as the switch response. Details are numerous and can be found e.g. in Skolnik [1]. The “bistatic” arrangement shown in Figure 2 has two separate antennas, one connected to the transmitter, the other to the receiver. The transmitted signal illuminates the volume of interest, and the receiver (or more receivers) detect the existence, distance and position of a target (or, multiple targets). Antennas are often arranged as a matrix for a better pointing, also the mechanical antenna movement for pointing can be replaced by electrical scanning. [2] Doppler-Effect Radars To detect a moving object, an unmodulated (CW) signal can be used. As shown in Figure 3, the receiver in this type of sensor processes (in principle, multiplies) the transmitted signal with the received signal reflected from a target. Due to the Doppler effect, the mutual speed of an object related to the antenna causes a frequency shift that is determined by: 34 High Frequency Electronics Figure 5 · Spacek Labs prototype of the mm-wave module in Fig. 4. F = dφ/dt · 1/2π = 2f/c dr/dt = 2vf/c (2) Where v is the velocity (mutual speed) in meters per second, f is the signal frequency, Hz, and c is again the speed of light. Recently, anti-collision radars are being developed to be deployed in automobiles. The operation frequency is ~77 GHz, but for illustration we can more easily estimate the Doppler frequency for a probing signal at 10 GHz, and car speed of 100 km/h: F = 2.100/3600 10E10/(3.10E5) = 1851 Hz It can be simply estimated that the Doppler frequency (which is the beat frequency obtained in receiver) is the number of the half-waves of the signal frequency passed by the target per second. A higher speed will produce a higher Doppler frequency. Such a system, with a provision for detecting signal phase, can also indicate the sense of target movement: escaping objects generate a lower frequency than the one of the probing signal, approaching objects generate a higher frequency. High Frequency Design MICROWAVE SENSORS TX Antenna Modulator Pulse Shaper Circulator Target Signal Processor Mixer-Multiplier (correlator) Such Doppler systems are a heart of well-known police speed radars: a typical range is up to 100 meters using a typical transmitter power of 10-100 mW. Doppler radars also can be used to measure the speed of poured construction materials, of very-high speed objects, and objects located in very dense environment like mining or iron/steel mills. Doppler systems are usually low-cost, and when installed in triangle, one can measure a target’s vector speed. Devices operating at millimeter waves may one day assist blind persons in their daily navigation. Figure 4 presents an anti-collision radar module utilizing millimeter waves. Figure 5 shows an example of an automotive radar mm-wave block developed by Spacek Labs. Ultra Wideband Systems Ultra-wideband (UWB) systems represent an old and new technology. The signal structure used in UWB systems is reminiscent of spark telegraphy, in that it uses very short “monocycle” bursts or pulses with a very wide spectrum. By doing this, and by correlating the transmitted and/or reflected signals with the original, amplitude over frequency features allow us to determine objects’ presence and shape in lossy media (e.g., ground-penetrating radar, GPD), or to transmit high-data rate information (just now in development). A typical UWB sensor schematic is shown in Figure 6. GPD usually operates over the frequency band of 2002000 MHz and radiates its pulsed power of ~10W into the soil to detect mines, pipes, and the like. The higher frequency band was recently allocated by FCC, covering ~3 to 10 GHz, with only very low power allowed to prevent interference to existing communication systems. The UWB transmitter typically generates only one wave, and the response is correlated to obtain the time delay, pulse power and phase. There are many problems to resolve before a good sensor is presented. One of the High Frequency Electronics Transmitter Signal Processor Receiver Antenna Target RX Antenna Figure 6 · Ultra wideband (UWB) sensor with correlator mixer. TX and RX antennas can be combined. 36 FM Modulator Figure 7 · FM-CW radar sensor.For short distances, the circulator can be replaced with a less-costly power divider/coupler. problems is antenna design: many well-known antennas do not have flat reponse over frequency, and affect the pulse shape and phase. The “reverse” thinking of designers should be readjusted for this and other new challenges of UWB [3]. FM-CW Radars Radars using frequency-modulated continuous-wave signals can combine the Doppler-radar’s capability to measure target speed with the added ability to measure target distance. Unlike pulsed-radar systems, distance can be measured essentially from zero. The system schematic of FM-CW radar is shown in Figure 7. FM-CW systems usually sweep the signal frequency over a band ∆ f, with a time period T. By multiplying the transmitted and received signals, a new beat frequency F is generated: F = 4 ∆ f r /(cT) (3) Where r is again the target distance, meters, c the speed of light, and T the sweep period, seconds. When the target is moving, in addition to the frequency F in (3), the Doppler frequency as in (2) will be generated. This makes possible to detect the movement sense only by evaluating the output signal spectrum. A typical application is in airplane radio altimeters which indicate the actual airplane height over terrain. This system has an inherent error in determining the target distance, which only depends upon the sweep bandwidth: ∆ r = c/(4 ∆ f) (4) For instance, old altimeters used a bandwidth of ~50 MHz, with which the distance error was ~1.5 meters, negligible for airplanes flying up to 10,000 meters above terrain. But for industrial applications where ranging over Object Receiver A Transmitter Insertion Loss Indicator Processor Antenna High Gain Amplifier BPF Antennas Detector “Warm” Body Receiver B Insertion Loss Indicator Figure 9 · Microwave radiometer funtional diagram. Figure 8 · Transmitter-receiver sensor. Insertion loss and reflection loss are often angle-dependent. short distances is important, ∆ f should be adjusted to make ∆ r acceptable. As shown in [5], by using two-frequency modulation, distance was measured over a range 0 to 200 mm with an error of <2 mm. FM-CW sensors are simple and low-cost, and could find industrial applications where IR or optical sensors fail due to the presence of dust, smoke or vibrations. Recently, FM-CW microwave sensors with dielectricrod or horn antennas have been widely marketed for liquid-level indication in tanks [6]. Transmitter-Receiver Systems The transmitter-receiver systems are presented separately as they offer other features than the above, which also use transmitters and receivers. As shown in Figure 7, those systems are close to their optical equivalents in that the purpose of the arrangement is mainly to measure insertion loss or reflectivity of tested objects, not distance or movement. During the measurement, for insertion loss, the “standard” power level is measured without a lossy object, then with it. For reflectivity, the “standard” power level is taken with a good reflector, e.g. an aluminum plate mirror adjusted to 45 degrees. Comparing insertion loss and reflectivity of similar objects is often useful to evaluate object form, material composition uniformity or contamination. For special purposes in science, polarization of waves is also studied, using polarimetric analyzers. They allow a tensor characterization of objects or media. Finally, the tested object must be fixed between the antennas as shown in Figure 8 for good results. If moving objects are to be tested, skip to the section “Noise Utilizing Devices.” Radiometers Passive detectors, “radiometers,” are essentially sensitive microwave receivers capable to detect mainly ther- TA To Radiometer φ ψ “Warm” Body with Temperature T φ is the viewing angle; ψ is the antenna beam width TA ~ T if φ ≤ ψ TA = T ( ψ2 /φ ) for φ > ψ Figure 10 · Illustration of the microwave radiometry principle. mal radiation of objects. [8]. Figure 9 presents the basic diagram of a microwave radiometer. Two principal features of radiometers are: 1) Temperature resolution in Kelvins, achieved by using low-noise receivers, and by smoothing the output voltage; sometimes also by interrupting the input noise: –1/2 dT = Ts (Bt) (5) Where dT is the smallest temperature variation distinguished (K), Ts is the system noise temperature (K), B is the system RF bandwidth (Hz) and t is the time constant of system integrator, s. 2) Spatial resolution, determined by antenna parameters, in steradians. This resolution allows to separate two objects before the antenna. See Figure 10 for an illustration of the microwave radiometry principle. In addition to detecting object temperature over a distance, radiometers can measure spectral characteristics of ionized gas or plasma, etc. In short, it can be said that a radiometric system (radiometer plus antenna) is a temperature-measuring device operating over a distance. Astronomers use such devices with radio telescopes to precisely measure surface temperature of distant planets. [9]. Designing microwave radiometers remains an art but April 2007 37 High Frequency Design MICROWAVE SENSORS Resonator Resonator Signal Generator Actuator Movement transferred to wall of resonator Signal Generator Actuator Movement transferred to parasitic element Detector Detector Indicator Indicator Figure 11 · Microwave resonator movement sensor using a moving or deformable wall. as microwave and mm-wave components become available in good quality and low cost, their deployment will be soon common in industry as well as in scientific applications. Movement pick-up Figure 12 · Microwave resonator movement detector using a moving parasitic element. Selecting the operating frequency for a radiometric sensor is important. It is essential to avoid interference by other radar and communication systems, while there are natural phenomena to know: For radiometer antennas pointed to the sky, precipitations emit microwave noise above 8-10 GHz, with clouds also contributing [8]. At 23.4 GHz, water-vapor resonance in the atmosphere offers a means to evaluate its density and height distribution, usually with comparison to a 31 GHz reference frequency. At 50-60 GHz, oxygen emission/ absorption lines can be used for the Axial guide Control Unit Oscillator Power Supply DVM HP8350A Antenna LB040 Keyence Laser Scale Parasitic Element Gunn Diode or Transistor Horn Modulator Figure 13 · A prototype of the sensor of Fig. 12. 51.35 GHz Generator Detector aluminum foil HP83556A Vector Network Analyzer Antennas 1 kHz Driver Precision Sliding Platform Sample VSWR Meter Y X HP54600A Ocilloscope HP Color Pro Plotter Tested object Figure 14 · Impedance-measuring sensor. 38 High Frequency Electronics Figure 15 · Experimental setup for measuring dielectric permittivity of concrete at 50 GHz. Noise Generator Radiometer Antenna A Indicator Antenna C Antenna B ENR (dB) — Excess Noise Ratio at A Radiometer resolution dT ( _ ), K Tested object Avalanche noise diodes 30 k 10 1k k 0.1 20 Gas-discharge noise tubes 10 0 10 20 30 40 50 Insertion Loss (dB) — A-C or B-C in Fig. 15 Figure 16 · Microwave noise sensor indicating insertion loss. It can indicate reflectivity is noise is radiated from location B. study of higher atmosphere. Above 120 GHz, there are multiple resonances of atmospheric gases, again useful for studying the atmosphere. Resonator Sensors To measure movement and vibration of objects, there are many other sensors as well, utilizing electrical capacitance, induction, infrared and optical methods. Using a microwave resonator is possible, and in certain situations, this technology can be preferred. Usually, microwave sensors are sensitive, able to survive overdrives and their signal can be directly transmitted over a distance to be evaluated at a safe location. There are many principles of resonator sensors, usually deforming their conductive walls, as shown in Figure 11. [10]. Long ago, the author needed a sensor with a low inertial mass to measure low-frequency vibration in seismography, so he developed and patented [11] a sensor with a parasitic element in a microwave resonator (Figure 12). The sensor was used in one version to calibrate seismometers (resolution <10 µm, frequency 0-20 Hz). Another version was a small microwave transmitter with its frequency varied by a spring-mounted parasitic element, as in Figure 13. This version transmitted the P-wave pulse above an underground explosion, by a ~10 GHz sig- Figure 17 · Estimation of noise sensor sensitivity by noise ENR at position A and radiometer resolution dT at position C in Fog. 16. nal, to a remote receiver located at a safe place. Both sensors could be overdriven heavily while maintaining their sensitivity. [12]. Impedance Meters Impedance-measuring sensors are close to the Transmitter-Receiver systems described earlier. They differ in that, instead of antennas, “applicators” are used to transmit the generated microwave field into and out of the tested sample or object. One or two applicators can be used, as e.g. in Figure 14. The microwave test instrumentation is often a Vector Network Analyzer allowing to measure insertion loss, reflectivity and time delay over a chosen frequency band. Instead of such complex and expensive instrumentation, simpler Sand layer NG structures using a bridge or a reflectometer are designed for particular applications [13]. The author designed a simple reflectometer operating at ~50 GHz to measure the permittivity of a concrete plate, see Figure 15 [14]. The results were comparable and even more accurate than those obtained by a special polarimetric radar while the sensor and its operation were quite simple. Noise Utilizing Sensors Whenever microwave sensors as outlined above are used, interference fields appearing close to antennas can be important obstacle in a real installation. Components of microwave sensors, mainly antennas, cause signal reflections as well as surrounding objects. Often it is diffiIF Amp Detector Audio Amp BPF 1 kHz Det. Indicator LNC A/D 1 kHz RS-232 NG — Noise Generator, 1 kHz modulated LNC — Low Noise Converter, 11 GHz in this case BPF/Detector/Indicator — Selective Audio Level Meter, 1 KHz Figure 18 · System to measure moving object loss using noise. April 2007 39 High Frequency Design MICROWAVE SENSORS 10 8 × Loss (dB/cm) Noise 6 × CW Signal × 4 × 2 × × 0 0 2 Figure 19 · wavelength. 4 6 8 Water Content (%) 10 12 14 Measured loss of sand layer at 2.5 cm cult to separate such interference from the useful signal. Utilizing microwave noise as a probing signal was pioneered by the author in a number of instruments and sensor designs [15]. The principles of TransmitterReceiver or Radiometer systems remain, but a noise radiator is used as the probing signal source, and a radiometer as a typical receiver. Creating a noise field in and outside of an antenna brings an important advantage: the interference field is random in time, and its effects are removed by output smoothing. It was observed that the tested objects could be moderately moved during sensor operation without affecting the measurement. Figure 16 presents a diagram of the noise system, Figuse 17 shows the coverable loss by different source ENR and radiometer resolution. As one typical example, a sand-moisture measuring system was designed and tested in a concrete-mixing factory. [16]. The moisture of the sand moving on a conveyor or pouring chute could be determined over 0-14% with ~1% accuracy. Figure 18 presents the schematic diagram of the developed sand-moisture measuring system. Figure 19 shows the calibration response of the described sandmoisture meter using noise. Another noise test system was used to measure reflectivity of hot-aluminum-metallized plastic boards. It was detected that aluminum particles baked into the plastic support created a partially-conducting layer which did not reflect correctly back under the angle of incidence. Recently, the author has experimented with Microwave Coherence Tomography [17] which was confirmed capable of expanding on the success generated in the field of the Optical Coherence Tomography during the last decade [20]. More development is needed, but the MCT sensor could be utilized in medicine to detect tissue 40 High Frequency Electronics Figure 20 · Michelson Interferometer setup fo use in Microwave Coherence Tomography. profiles in depth, with a reasonable resolution. Figure 20 shows the MCT test system. Modulated Targets Modulated targets, or, often called modulated scatterers, offer to all above sensing methods several useful advantages: 1) The loss or reflectivity can be periodically keyed by the modulating square-wave signal, and the response can be retrieved by synchronous detector, improving the signal-to-noise ratio of the system Figure 21 · The partially-coherent source is provided by a noise diode (E-B junction of a transistor) connected directly to an antenna. High Frequency Design MICROWAVE SENSORS Unmodulated Signal Modulated Scattering Probe Source DUT Circulator High-frequency receiver Modulated Signal Low-frequency coherent detector Low-frequency modulator Figure 22 · Electrical modulation setup in a monostatic configuration, also showing the frequency spectrum of the incoming signal (CW) and of the reflected signal (modulated). 2) It is possible to use more modulated targets (scatterers) with different modulating signals, to simultaneously obtain data from more locations. 3) The sensor operation can be easily automated and/or digitized. Figure 21 presents a schematic of one particular modulated-target system. There are many other variations on the system design, described in [19]. Conclusion In the above, the author presented only some examples of a wide selection of sensors utilizing microwave technology; other types have been or are being developed. The size of microwave wavelengths compares well with the human body size and with objects we encounter in daily life. While sensors using other methods, also optical and IR, can offer a high accuracy and other advantages, microwave and millimeter-wave sensors are gradually coming into light as the cost of devices is decreasing. Given recent interest in sensor ttechnologies, we will certainly see 42 High Frequency Electronics more microwave, millimeter and terahertz-wave sensors in near future. References 1. M.I. Skolnik, Radar Systems, McGraw-Hill, NY, 2001. 2. M. Harvey, Microwave Engineering, McGraw-Hill, NY, 1961. 3. M. Ghavami, L.B. Michael, R. Kohno, UWB Signals and Systems, John Wiley & Sons, UK, 2004. 4. M. Harvey, Microwave Engineering, McGraw-Hill, NY, 1961. [5] T. Shiraiwa, S. Kobayashi, “Applications of Microwave Techniques in Steel Industry,” Proc.of SIMAC 1974, Tokyo, P16, pp. 1-12. 6. “Low-Cost Smart Radar Sensing Liquid Levels,” HITECH Technology, www.hitechtech.com and many others. 7. G.C. Rose. et al. “Determining of Complex Diel. Constants,” IEEE Trans. IM-21, Aug. 1972, pp. 286-7. 8. J. Polivka, “Microwave Radiometry and Applications,” International Journal of IR/MM Waves, Vol.16, No. 9, Sep. 1995, pp. 1593-1672. 9. J.D. Kraus, Radio Astronomy, McGraw-Hill, NY, 1967. 10. W.K. Saunders, “Resonator Sensors,” IRE Trans. ANE-8, March 1961, pp.7-19. 11. J. Polivka, “Resonator Sensor of Movement and Vibration,” Czech. Pat. No. AO 166546, 1975. 12. J. Polivka, “Movement and Vibration Sensor Using a Microwave Stripline Oscillator,” Microwave Colloquium, Czech Technical University, Prague, 1979. 13. M. Tiuri, “Microwave Sensor Applications in Industry,” Alta Frequenza, LVI, No. 10, Dec. 1987, pp. 393-397. 14. J. Polivka, “Measuring Concrete Permittivity at Millimeter Waves,” Internat. Journal of IR/MM Waves, vol. 17, No.10, 1997, pp. 1673-1683. 15. J. Polivka, “Noise Can Be Good, Too,” Microwave Journal, March 2004, pp. 66-78. 16 J. Polivka, “Microwave Radiometry in Measuring Sand Moisture,” 3rd Internat.Workshop on Electromagnetic Wave Interaction With Water and Moist Substances, Athens, Georgia, 1999, Apr. 11-13. 17. J. Polivka, “Experiments with Microwave Coherence Tomography,” High Frequency Electronics, 2006, Part 1, July, pp. 36-40, Part 2, August, pp. 36-43. 18. RISOE Report by L. Thrane et al., DOPS-NYT 4-2001 (Danish Optical Society, Roskilde, Denmark, also http://e.wikipedia.org/wiki/OCT. 19. J-C. Bolomey, F. Gardiol, Engineering Applications of the Modulated Scatterer Technique, Artech House, Boston, 2001. 20. Y-J. Park, et al., “Buried Small Objects Detected by UWB GPR,” IEEE A&E Systems Magazine, Oct. 2004, pp. 3-6. Author Information Dr. Jiri Polivka is Chief Scientist at Spacek Labs Inc., 212 East Gutierrez St., Santa Barbara, CA 93101. He can be reached by telephone at 805-564-4404 or by e-mail at polivka@spaceklabs.com. The company web site is www.spaceklabs.com.
