Income Statement Exercises: Accounting Worksheet
advertisement

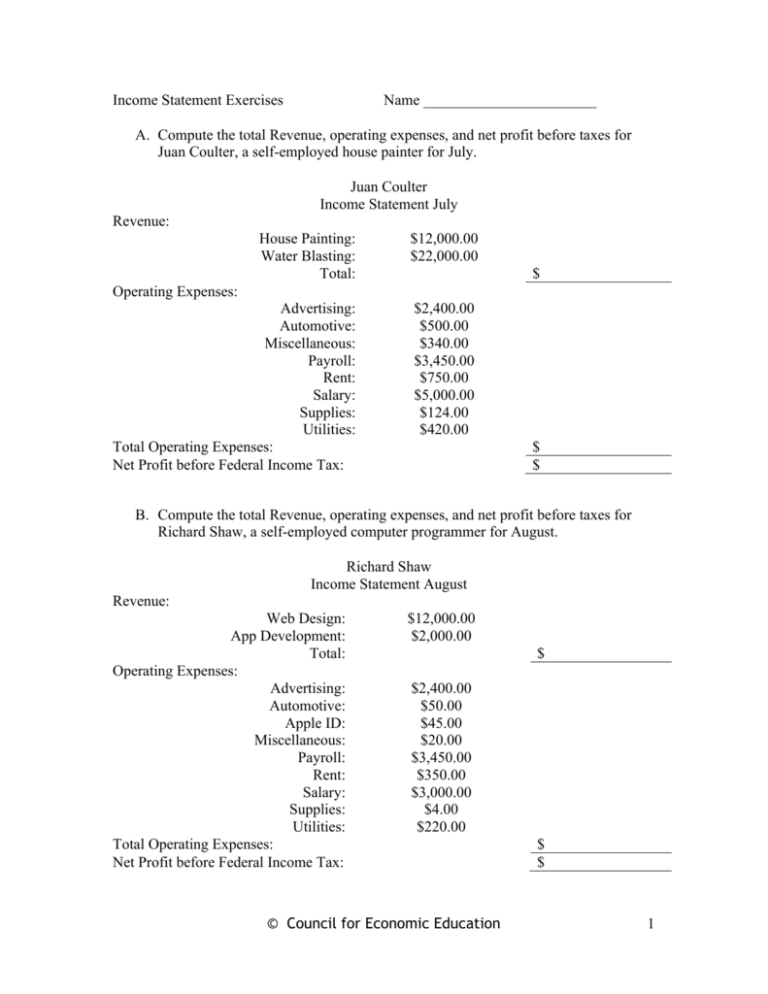
Income Statement Exercises Name _______________________ A. Compute the total Revenue, operating expenses, and net profit before taxes for Juan Coulter, a self-employed house painter for July. Juan Coulter Income Statement July Revenue: House Painting: Water Blasting: Total: $12,000.00 $22,000.00 Advertising: Automotive: Miscellaneous: Payroll: Rent: Salary: Supplies: Utilities: Total Operating Expenses: Net Profit before Federal Income Tax: $2,400.00 $500.00 $340.00 $3,450.00 $750.00 $5,000.00 $124.00 $420.00 $ Operating Expenses: $ $ B. Compute the total Revenue, operating expenses, and net profit before taxes for Richard Shaw, a self-employed computer programmer for August. Richard Shaw Income Statement August Revenue: Web Design: App Development: Total: Operating Expenses: Advertising: Automotive: Apple ID: Miscellaneous: Payroll: Rent: Salary: Supplies: Utilities: Total Operating Expenses: Net Profit before Federal Income Tax: $12,000.00 $2,000.00 $ $2,400.00 $50.00 $45.00 $20.00 $3,450.00 $350.00 $3,000.00 $4.00 $220.00 © Council for Economic Education $ $ 1 C. Wester World is a merchandising store. Complete the Total Revenue, Gross Margin, Operating Expenses, and Net Profit before federal income tax. Wester World Inc. Income Statement December 31, 2012 Revenue: Sales: Less: Sales returns and allowances Net Sales: Cost of Goods sold: Gross Margin: Operating Expenses: Advertising: Delivery: Depreciation: Insurance: Office Supplies: Telephone: Utilities: Total Expenses: Net Income before taxes: $800.00 $10.00 $ $395.00 $ $60.00 $40.00 $59.00 $36.00 $14.00 $50.00 $36.00 $ $ D. Merchandising businesses have to calculate the “Cost of Goods Sold” on their income statement. The Cost of Goods Sold represents how much it cost the firm to generate its sales. Complete the table below after examining the calculations used in the example. (Beginning Inventory + Purchases = Total Cost of Goods Available for Sale) (Total Cost of Goods Available for Sale – Ending Inventory = Cost of Goods Sold) Cost of Goods Sold Beginning Purchases Total Cost of Goods Ending Cost of Goods Inventory (+) Available for Sale Inventory Sold (-) 1 $220,000 $38,240 $181,760 $ 55,276 $126,484 2 66,000 39,200 60,225 3 145,568 20,200 87,432 4 10.947 50,925 30,439 5 884,948 200,000 300,000 6 10,900 60,000 $ 48,900 7 566,891 $530,303 $489,735 E. Compute the component percentages for Big Top. Round answers to two decimal places. Big Top, Inc. © Council for Economic Education 2 Income Statement December 31, 2012 Revenue: Sales: Less: Sales returns and allowances Net Sales: Cost of Goods sold: Gross Margin: Operating Expenses: Advertising: Delivery: Depreciation: Insurance: Office Supplies: Telephone: Utilities: Total Expenses: Net Income before taxes: Federal Income Tax: Net Profit after taxes: $9,450.00 $673.41 $8,776.59 $4,395.00 $4,381.59 100% % % % % % % % % % % % % % % % % $604.00 $550.00 $859.00 $16.00 $36.00 $520.00 $36.00 $2,621.00 $1,760.59 $528.18 $1,232.41 F. Complete the Income Statement for James Weaver, M. D. that appears below. James Weaver, M.D. Income Statement 2011 Revenue: General Practice: Operations: Total: $290,000.00 $255,000.00 Advertising: Automotive: Miscellaneous: Payroll: Rent: Salary: Supplies: Utilities: Total Operating Expenses: Net Profit before Federal Income Tax: $10,983.00 $500.00 $5,340.00 $ $20,750.00 $200,000.00 $55,839.00 $3,520.00 $ Operating Expenses: © Council for Economic Education $446,932 $ 3 G. For each company in the office furniture industry below, divide net income by sales to find the profit margin. Round answers to two decimal places. Company HNI Steelcase Herman-Miller Kimball Sales Net Income Return on Sales (%) 1,686,728 26,941 2,437,100 20,400 1,649,200 70,800 1,122,808 10,803 © Council for Economic Education 4


