Project GRAD Health .-\ssessment Survey Test
advertisement
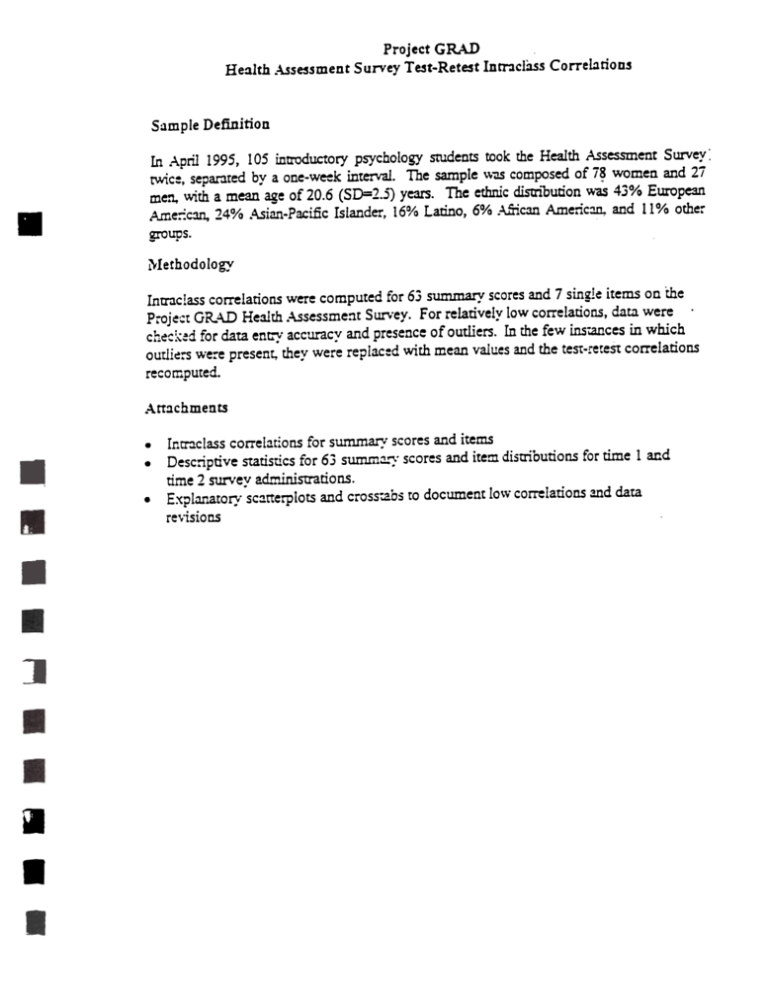
Project GRAD Health .-\ssessmentSurvey Test-RetestIn~cl3ss Correl.1tioDs S:lmple Definition In April 1995, 105 inttoductory psychology StUdentstook the Health Assessment Survey: tWic:, separated by a one-w~k interla1. The sample \v~ composed of i~ women and 2i men. with a mean age of 20.6 (SD=2.5) years. The ethnic distn"bution~-as43% Etn-Opean Ame'-:c:ln, 24% .A.sian-PacmcIslander, 16% Latino, 6% .~can Amenc:ln. and 11% other groups. i\rIethodology Intrac!ass correlations were computed for 63 summary scoresand 7 single items on "the Projc:ctGR.:W Health .-\.ssessme:ltSur.-ey. For relatively low correlations. data were ch~~:-=~d for data en~- accuracy and presenceof outliers- In the few ins~ces in which outli~rs were present, they were replac:d with mean values and the teSt-reteStcorrelations recomputed. .-\tt~chments Intr:lclass correl~tions for summary scores and items Descriptive Statistics for 63 summ~,,:,.scores and item distributions for time 1 and time 2 survey ad.."liniStI'ations. Expl.1Ilator'f. sc~tterplotSand cross-.a.bs to document lo\v correlations and data revisions ~ .. PrOJec: G~;'C Variable hrbsum1 safety dmkdrv hsactiv compyrs recyrs totcoly colyrs exs:age pas:age totwk dayswk walktot lifwlk hrbsum2 Name :-:ealth Assessment Variable Description Scales Risk 6 Items Seatbelt& Helmet Drink& Drive High School Ac:ivirl College Competitive College Re'::'eational Total College Years Other College Sports Exercise Stase of Change Phys Ac~v Stase of Change NHIS Walking ~er Week NHIS Days Wa!ked convsrc workscr envsum1 envsum2 Paffenbarger ',',!a!l<lng Paffenbarger Lifestyle Walking Risk 4 Activity Items (Stretch-Sport) TV per Week Sum of 25 Ac:ivities 25 Activities Weighted by METs Lifestyle Ac-jvity Minutes 25 Ac:ivities: \Vaiking Enjoyment Sc=re Home Equipment Score Neighborhood Score 10 Items Neignborhooc Sc~re 8 Items Convenience Facilities Work Facilities Total Envircnme."it 'Mth Work Total Environment 'Mthout Work fa~.c.1 frnprt Scc:af Su;;c.-::,='amily Participation Pa "; c " Soc ;j ~I'~~--';'; ..0 o. end .a _..,..,..~I .,.. 'pation fampun tctpart barrsum aversum incvsum Social Supcort:.~amily Punishment Social SuPccr!:Total Participation Bariler Totai Barrier: Aversiveness Subscale tvperwk ac:sum kkdacts lifact walkscr enjsum homeq n ~~~~.. I ", I nhood8 Barrier:lnconvenience Subscale physsum psycsum dec~al Barrier:Worries Subscale Barrier: Excuses Subscale Barrier:Demands Subscaie Benefits Total Ee!'1efits: Physic21 Benefits: Fs:c~.::c;icai ~ c.: L.I -; .-= r" e "-I I' s :o II~ al c chngsum expsum behsum Procsss of C~ange Total Process of Char:ge:E.xper:entiaJ Process of Cr=~s~: Behavioral confsum Exercise Conficence Conficenc:. ~',:akeTime worysum excusum dmndsum benesum maketim Survey Test-Ret! Intraclass 0.86 0.83 0.81 0.79 0.71 0.69 0.75 0.86 0.84 0.52 0.66 0.57 0.68 0.68 0.82 0.8 0.77 0.8 0.62 0.67 0.78 0.89 0.68 0.86 0.81 0.79 0.45 0.9 0.83 0.82 0.63 0.81 0.79 0.72 0.79 0.61 0.71 0.62 0.75 0.04 0.71 0.82 0.85 0.79 C.oS 0.78 0.77 8J rsstsum imagsum edisum malesum femlsum qol person wor1<lif self whUif Confidence: Resisting Relapse Body Image Total Body Image: EDI Body Image:Male Body Image: Female Quality of Life Total Quality of Life: Personal Life Quality of Life: Work Life Quality of Life: Self Quality of Life:Life as a 'Nhole tobacco Risk: Tobacco safesex Risk: Safesex foodsum frutsum Fruits & Vegetables Eaten fatfsum staysum agehi agelo gym ses quit 0.87 0.82 0.71 0.7 0.81 0.78 0.96 0.87 Foods Eaten Yesterday Total Fatty Foods Eaten Behavioral Techniques to Stay Active Items gpa kids 0.65 0.91 0.88 0.82 Student GPA Number of Kids in the home Highest Age of Kid in the home Lowest Age of Kid in tJ1ehome Member of a Gym SES Tried to Quit Smoking 0.59 0.63 0.41 0.8 0.92 0.89 0.96 0.97 0.73 0.92 0.84


![This article was downloaded by: [Segal, Daniel L.] On: 29 October 2009](http://s2.studylib.net/store/data/010460926_1-a39f874d03b74241abc6abedab02e488-300x300.png)
