CSE 142, Spring 2011 Programming Assignment #6: Baby Names
advertisement
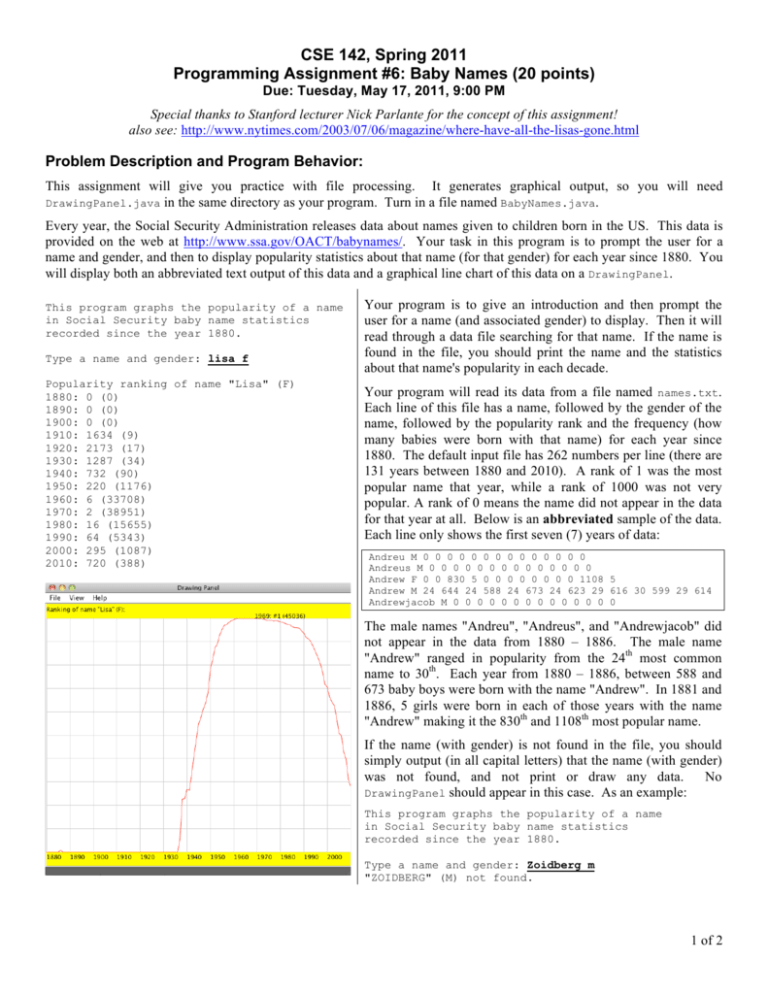
CSE 142, Spring 2011 Programming Assignment #6: Baby Names (20 points) Due: Tuesday, May 17, 2011, 9:00 PM Special thanks to Stanford lecturer Nick Parlante for the concept of this assignment! also see: http://www.nytimes.com/2003/07/06/magazine/where-have-all-the-lisas-gone.html Problem Description and Program Behavior: This assignment will give you practice with file processing. It generates graphical output, so you will need DrawingPanel.java in the same directory as your program. Turn in a file named BabyNames.java. Every year, the Social Security Administration releases data about names given to children born in the US. This data is provided on the web at http://www.ssa.gov/OACT/babynames/. Your task in this program is to prompt the user for a name and gender, and then to display popularity statistics about that name (for that gender) for each year since 1880. You will display both an abbreviated text output of this data and a graphical line chart of this data on a DrawingPanel. This program graphs the popularity of a name in Social Security baby name statistics recorded since the year 1880. Type a name and gender: lisa f Popularity ranking of name "Lisa" (F) 1880: 0 (0) 1890: 0 (0) 1900: 0 (0) 1910: 1634 (9) 1920: 2173 (17) 1930: 1287 (34) 1940: 732 (90) 1950: 220 (1176) 1960: 6 (33708) 1970: 2 (38951) 1980: 16 (15655) 1990: 64 (5343) 2000: 295 (1087) 2010: 720 (388) Your program is to give an introduction and then prompt the user for a name (and associated gender) to display. Then it will read through a data file searching for that name. If the name is found in the file, you should print the name and the statistics about that name's popularity in each decade. Your program will read its data from a file named names.txt. Each line of this file has a name, followed by the gender of the name, followed by the popularity rank and the frequency (how many babies were born with that name) for each year since 1880. The default input file has 262 numbers per line (there are 131 years between 1880 and 2010). A rank of 1 was the most popular name that year, while a rank of 1000 was not very popular. A rank of 0 means the name did not appear in the data for that year at all. Below is an abbreviated sample of the data. Each line only shows the first seven (7) years of data: Andreu M 0 0 0 0 0 0 0 0 0 0 0 0 0 0 Andreus M 0 0 0 0 0 0 0 0 0 0 0 0 0 0 Andrew F 0 0 830 5 0 0 0 0 0 0 0 0 1108 5 Andrew M 24 644 24 588 24 673 24 623 29 616 30 599 29 614 Andrewjacob M 0 0 0 0 0 0 0 0 0 0 0 0 0 0 The male names "Andreu", "Andreus", and "Andrewjacob" did not appear in the data from 1880 – 1886. The male name "Andrew" ranged in popularity from the 24th most common name to 30th. Each year from 1880 – 1886, between 588 and 673 baby boys were born with the name "Andrew". In 1881 and 1886, 5 girls were born in each of those years with the name "Andrew" making it the 830th and 1108th most popular name. If the name (with gender) is not found in the file, you should simply output (in all capital letters) that the name (with gender) was not found, and not print or draw any data. No DrawingPanel should appear in this case. As an example: This program graphs the popularity of a name in Social Security baby name statistics recorded since the year 1880. Type a name and gender: Zoidberg m "ZOIDBERG" (M) not found. 1 of 2 Graphical Output: If the name is found, you must construct a DrawingPanel to graph the data. Mark the year with the peak ranking (and frequency). If more than one year tie for highest ranking, mark only the latest year. To compute the best rank, you may assume that no rank is larger than a million. The black text appears above any other elements that would otherwise occupy the same pixels. Your panel must exactly reproduce the window appearance of the examples. The panel's overall size is 650x560 pixels. Its background is white. It has yellow filled rectangles along its top and bottom, each being 30 pixels tall and spanning across the entire panel, leaving an area of 650x500 pixels in the middle. Each year is represented by a width of 5 pixels. The width of the panel is (numYears – 1) * 5. Each decade is separated by vertical light gray (Color.LIGHT_GRAY) lines, each of which runs from y=30 to y=530. The bottom yellow rectangle contains black text labels for each decade, left-aligned and with the text's bottom at y=546. For example, the text "1880" has coordinates (0, 546) and "1890" has the coordinates (50, 546). The heading "Ranking of name ..." is located at (0, 16). A red line connects the data about the name's ranking over each year. The table at right shows the mapping between rankings and y-values. The y-values start at 30, and there is a vertical scaling factor of 2 between pixels and rankings, so you should divide a ranking by 2 when calculating its onscreen y-coordinate. If a name was not in the top 1000 or it did not appear at all (i.e., has a rank of 0), draw it at the bottom of the plot range. There are light gray horizontal lines every 50 pixels to indicate every 100 ranking points. For example, a line is drawn from (0, 80) to (650, 80) to mark the ranking of 100. The red lines appear on top of the grid. Rank 1 2, 3 4, 5 ... 998, 999 0 or >= 1000 y 30 31 32 ... 529 530 Implementation Guidelines: Your program should work correctly regardless of the capitalization the user uses. For example, if the user asks you to search for "LiSa f" or "lisa F", you should find it even though the input file has it as "Lisa F". The name that is displayed on the console and DrawingPanel should have capitalization matching the way it appears in the file. To draw the text labels, you will need to use the drawString method of the Graphics object. Some of the text labels you'll want to write will be ints, but you can convert them into Strings using the + operator with an empty string. For example, if you have an int named x with value 1880, the expression ("" + x) yields the string "1880". Stylistic Guidelines: For this program you should have four class constants to represent the following values: • • • • the name of the input file (default of "names.txt") the starting year of the input data (default of 1880) the number of years’ worth of data (default of 131) the width used for each year on the drawing panel (default of 5) It should be possible to change these values and have your output adapt appropriately. For example, if you change the constant to 1800, the program will now assume the file data comes from the years starting from 1800. The panel's overall width should adjust if your width or number of years constants are changed; for example, if you change the width to 7 and the years to 50, the panel's size should become 343x560. On the course website is a second input file named names2.txt that has 28 years’ worth of data you can use to test your constants. This is also a good file to start with! Use methods for structure and to avoid redundancy. For full credit, your methods should obey the following constraints: • • • The main method should not draw on a DrawingPanel, nor should it read lines of input from a file. The code that asks the user for a name must not be in the same method as any code to read lines of input from a file. You should split the task of displaying the data into at least two methods. For example, you could have one method to do the text output and one to do the graphical output, or you could have one method to draw the "fixed" graphical content (yellow bars, vertical lines, etc.) and another for the content that comes from the file (red line, ranks, etc.). For this assignment you are limited to the language features in Chapters 1 through 6 of the textbook. In particular, you are not allowed to use arrays to solve this assignment. Follow past stylistic guidelines about indentation, whitespace, identifier names, and localizing variables, and commenting at the beginning of your program, at the start of each method, and on complex sections of code. 2 of 2
