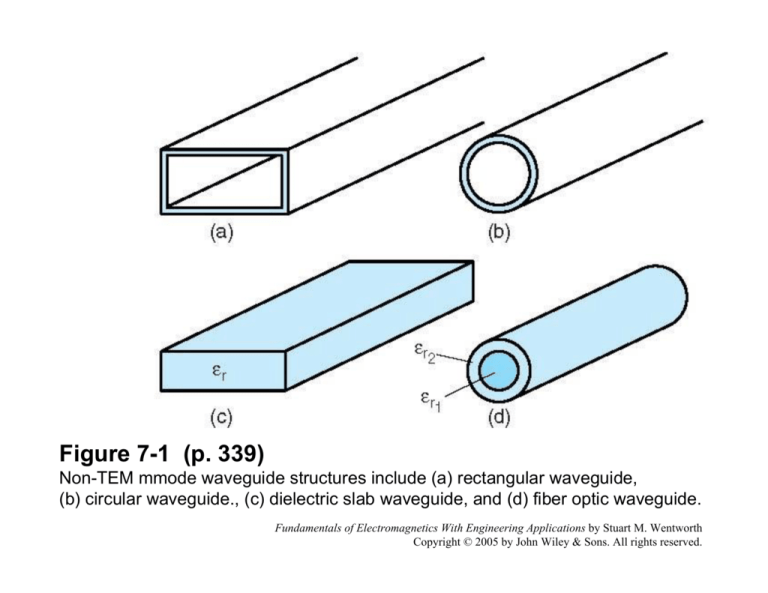
Figure 7-1 (p. 339)
Non-TEM mmode waveguide structures include (a) rectangular waveguide,
(b) circular waveguide., (c) dielectric slab waveguide, and (d) fiber optic waveguide.
Fundamentals of Electromagnetics With Engineering Applications by Stuart M. Wentworth
Copyright © 2005 by John Wiley & Sons. All rights reserved.
Figure 7-2 (p. 340)
Cross section of rectangular waveguide.
Fundamentals of Electromagnetics With Engineering Applications by Stuart M. Wentworth
Copyright © 2005 by John Wiley & Sons. All rights reserved.
Figure 7-3 (p. 341)
Location of modes relative to the dominant TE10 mode in standard rectangular
waveguide where a = 2b.
Fundamentals of Electromagnetics With Engineering Applications by Stuart M. Wentworth
Copyright © 2005 by John Wiley & Sons. All rights reserved.
Table 7-1 (p. 341)
Some Standard Rectangular Waveguides
Fundamentals of Electromagnetics With Engineering Applications by Stuart M. Wentworth
Copyright © 2005 by John Wiley & Sons. All rights reserved.
Figure 7-4 (p. 342)
The field patterns and associated field intensities in a cross section of rectangular
waveguide for (a) TE10 and (b) TE20. Solid lines indicate electric field; dashed lines
are the magnetic field.
Fundamentals of Electromagnetics With Engineering Applications by Stuart M. Wentworth
Copyright © 2005 by John Wiley & Sons. All rights reserved.
Figure 7-5 (p. 343)
(a) A y-polarized TEM plane wave propagates in the +z direction. (b) Wavefront
view of the propagating wave.
Fundamentals of Electromagnetics With Engineering Applications by Stuart M. Wentworth
Copyright © 2005 by John Wiley & Sons. All rights reserved.
Figure 7-6 (p. 343)
We take two identical ypolarized TEM waves, rotate
one by +θ and the other by –θ
as shown in (a), and combine
them in (b).
Fundamentals of Electromagnetics With Engineering Applications by Stuart M. Wentworth
Copyright © 2005 by John Wiley & Sons. All rights reserved.
Figure 7-7 (p. 344)
(a) Replacing adjacent zero field lines with conducting walls, we get an identical
field pattern inside. (b) The u+ wavefronts for a supported propagation mode are
shown for an arbitrary angle θ. (c) The velocity of the superposed fields, or group
velocity, is uG.
Fundamentals of Electromagnetics With Engineering Applications by Stuart M. Wentworth
Copyright © 2005 by John Wiley & Sons. All rights reserved.
Figure 7-8 (p. 347)
Waveguide impedance of the TE11 and TM11 modes versus frequency for WR90.
Fundamentals of Electromagnetics With Engineering Applications by Stuart M. Wentworth
Copyright © 2005 by John Wiley & Sons. All rights reserved.
Figure 7-9 (p. 349)
Depiction of a microwave oven.
Fundamentals of Electromagnetics With Engineering Applications by Stuart M. Wentworth
Copyright © 2005 by John Wiley & Sons. All rights reserved.
(a)
(b)
(c)
Figure 7-10a (p. 349)
Detail of a magnetron: (a) vertical cross section, (b) horizontal cross section
showing the conductive straps, and (c) the space-charge wheel.
Fundamentals of Electromagnetics With Engineering Applications by Stuart M. Wentworth
Copyright © 2005 by John Wiley & Sons. All rights reserved.
(a)
(b)
Figure 7-11ab (p. 356)
TM11 field distribution inside a rectangular waveguide. Adjacent to the left-column
contour plots are conventional plots taken across the middle of the guide. The
contour plot has been modified with heavier lines representing larger magnitudes.
Fundamentals of Electromagnetics With Engineering Applications by Stuart M. Wentworth
Copyright © 2005 by John Wiley & Sons. All rights reserved.
(c)
(d)
Figure 7-11cd (p. 356)
Continued.
Fundamentals of Electromagnetics With Engineering Applications by Stuart M. Wentworth
Copyright © 2005 by John Wiley & Sons. All rights reserved.
(e)
Figure 7-11e (p. 356)
Continued.
Fundamentals of Electromagnetics With Engineering Applications by Stuart M. Wentworth
Copyright © 2005 by John Wiley & Sons. All rights reserved.
Figure 7-12 (p. 358)
The TM11 Ez plots of MATLAB 7.2. This is a
black and white rendition of plots that will
appear in color when you run the program.
The contour plot has been modified with
heavier lines representing larger
magnitudes.
Fundamentals of Electromagnetics With Engineering Applications by Stuart M. Wentworth
Copyright © 2005 by John Wiley & Sons. All rights reserved.
Figure 7-13 (p. 360)
TE10 field plots are constant in the y
direction.
Fundamentals of Electromagnetics With Engineering Applications by Stuart M. Wentworth
Copyright © 2005 by John Wiley & Sons. All rights reserved.
Figure 7-14 (p. 362)
(a) A wave incident at an angle θi from εr1 material to εr2 material (εr1 > εr2).
(b) A critical angle for θi is reached where the entire wave is reflected.
Fundamentals of Electromagnetics With Engineering Applications by Stuart M. Wentworth
Copyright © 2005 by John Wiley & Sons. All rights reserved.
Figure 7-15 (p. 363)
(a) The wavefront for a supported propagation mode must have the same phase at
points A and C. (b) An expanded view of the problem’s geometry.
Fundamentals of Electromagnetics With Engineering Applications by Stuart M. Wentworth
Copyright © 2005 by John Wiley & Sons. All rights reserved.
Figure 7-16 (p. 365)
(a) The dielectric waveguide TE
modes for a 50-mm-thick dielectric
of εr = 4 operating at 4.5 GHz. The
bold line plots the value of the right
side of (7.86) on the vertical axis
against the angle. The other lines
plot the value of the left side of
(7.86) on the vertical axis versus
angle for different values of m.
(b) TE mode plots at m 0 for
several different frequencies.
Fundamentals of Electromagnetics With Engineering Applications by Stuart M. Wentworth
Copyright © 2005 by John Wiley & Sons. All rights reserved.
Figure 7-17 (p. 366)
(a) The dielectric waveguide TM
modes for a 50-mm-thick
dielectric of εr = 4 operating at
4.5 GHz. The bold line plots the
right side of (7.89) and the other
lines are the left side for different
values of m.
(b) TE mode plots at m 0 for
several different
Fundamentals of Electromagnetics With Engineering Applications by Stuart M. Wentworth
Copyright © 2005 by John Wiley & Sons. All rights reserved.
Figure 7-18 (p. 367)
Cross-sectional view of dielectric waveguide.
Fundamentals of Electromagnetics With Engineering Applications by Stuart M. Wentworth
Copyright © 2005 by John Wiley & Sons. All rights reserved.
Figure 7-19 (p. 369)
Ey field patterns for the first three TE modes of a 5-cm-thick dielectric guide (n = 2)
in air. The dielectric extends from x = –0.025 m to x = +0.025 m.
Fundamentals of Electromagnetics With Engineering Applications by Stuart M. Wentworth
Copyright © 2005 by John Wiley & Sons. All rights reserved.
Figure 7-20 (p. 370)
Typical optical fiber consists of a core surrounded by cladding and sheathed in a
protective jacket.
Fundamentals of Electromagnetics With Engineering Applications by Stuart M. Wentworth
Copyright © 2005 by John Wiley & Sons. All rights reserved.
Figure 7-21 (p. 370)
Cross section and index of refraction profile of a step=index fiber with rays for two
propagating modes traced.
Fundamentals of Electromagnetics With Engineering Applications by Stuart M. Wentworth
Copyright © 2005 by John Wiley & Sons. All rights reserved.
Table 7-2 (p. 371)
Typical Characteristics of Glass Optical Fiber.
Fundamentals of Electromagnetics With Engineering Applications by Stuart M. Wentworth
Copyright © 2005 by John Wiley & Sons. All rights reserved.
Figure 7-22 (p. 372)
Expanded view of the cross section of an optical fiber at one end for determining the
acceptance angle.
Fundamentals of Electromagnetics With Engineering Applications by Stuart M. Wentworth
Copyright © 2005 by John Wiley & Sons. All rights reserved.
Figure 7-23 (p. 375)
Typical attenuation in silica fiber with the three common usage bands indicated.
Fundamentals of Electromagnetics With Engineering Applications by Stuart M. Wentworth
Copyright © 2005 by John Wiley & Sons. All rights reserved.
Figure 7-24 (p. 375)
Graded-index fiber shown with a parabolic index profile.
Fundamentals of Electromagnetics With Engineering Applications by Stuart M. Wentworth
Copyright © 2005 by John Wiley & Sons. All rights reserved.
Figure 7-25 (p. 376)
Typical optical fiber communication.
Fundamentals of Electromagnetics With Engineering Applications by Stuart M. Wentworth
Copyright © 2005 by John Wiley & Sons. All rights reserved.
(a)
(b)
Figure 7-26 (p. 376)
(a) Forward-biased photodiode emits photons. (b) Simplified cross section of a
Burrus surface-emitting diode.
Fundamentals of Electromagnetics With Engineering Applications by Stuart M. Wentworth
Copyright © 2005 by John Wiley & Sons. All rights reserved.
Figure 7-27 (p. 377)
Simplified cross section of a GaAs laser diode.
Fundamentals of Electromagnetics With Engineering Applications by Stuart M. Wentworth
Copyright © 2005 by John Wiley & Sons. All rights reserved.
Table 7-3 (p. 378)
Property Comparison for LEDs and Laser Diodes
Fundamentals of Electromagnetics With Engineering Applications by Stuart M. Wentworth
Copyright © 2005 by John Wiley & Sons. All rights reserved.
Figure 7-28 (p. 379)
Simplified cross section of a PIN photodiode.
Fundamentals of Electromagnetics With Engineering Applications by Stuart M. Wentworth
Copyright © 2005 by John Wiley & Sons. All rights reserved.
Table 7-4 (p. 379)
Comparison of Optical Detectors
Fundamentals of Electromagnetics With Engineering Applications by Stuart M. Wentworth
Copyright © 2005 by John Wiley & Sons. All rights reserved.
Figure 7-29 (p. 380)
Simplified view of a repeater.
Fundamentals of Electromagnetics With Engineering Applications by Stuart M. Wentworth
Copyright © 2005 by John Wiley & Sons. All rights reserved.
Figure 7-30 (p. 380)
Erbium-doped fiber amplifier.
Fundamentals of Electromagnetics With Engineering Applications by Stuart M. Wentworth
Copyright © 2005 by John Wiley & Sons. All rights reserved.
Table 7-5 (p. 381)
Typical Losses Associated with Connections
Fundamentals of Electromagnetics With Engineering Applications by Stuart M. Wentworth
Copyright © 2005 by John Wiley & Sons. All rights reserved.
Figure 7-31 (p. 383)
(a) In the return-to-zero data format, the first half of a period T is occupied by either
a 1 or a 0. The pulse width tpw is measured across the pulse at half power.
Fundamentals of Electromagnetics With Engineering Applications by Stuart M. Wentworth
Copyright © 2005 by John Wiley & Sons. All rights reserved.
Figure 7-32 (p. 383)
A pulsed electrical signal
modulating the light source (a) is
distorted by the rise time of the
optical source (b) and is further
distorted by dispersion in the fiber
(c) and finally by the rise time of
the optical detector (d).
Fundamentals of Electromagnetics With Engineering Applications by Stuart M. Wentworth
Copyright © 2005 by John Wiley & Sons. All rights reserved.

