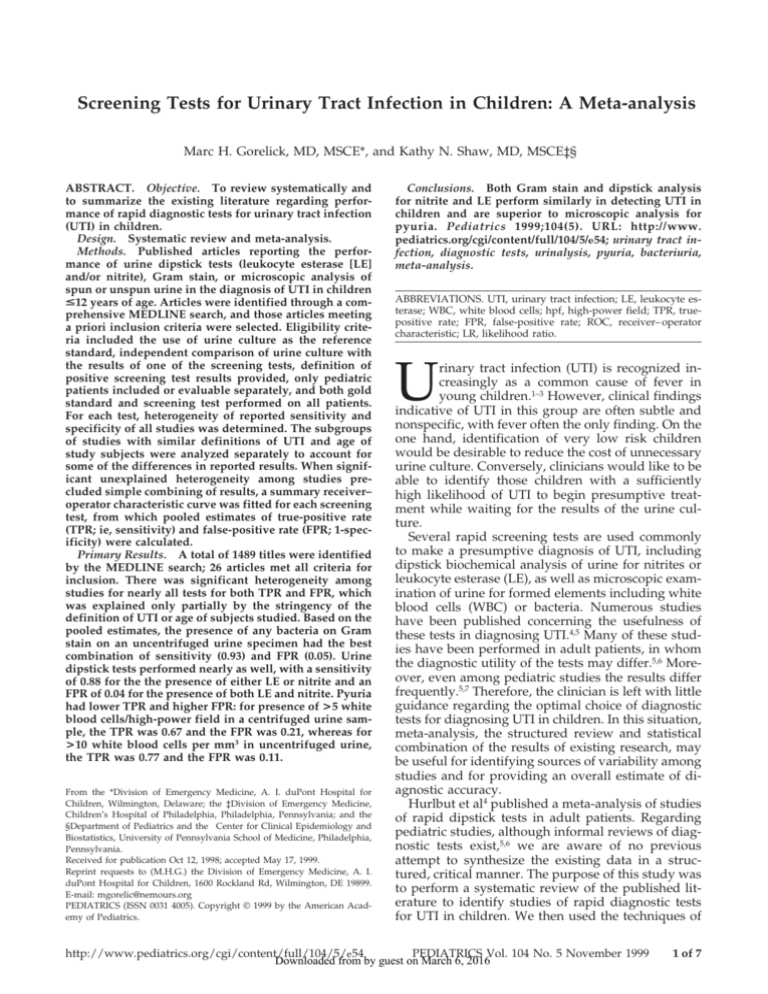
Screening Tests for Urinary Tract Infection in Children: A Meta-analysis
Marc H. Gorelick, MD, MSCE*, and Kathy N. Shaw, MD, MSCE‡§
ABSTRACT. Objective. To review systematically and
to summarize the existing literature regarding performance of rapid diagnostic tests for urinary tract infection
(UTI) in children.
Design. Systematic review and meta-analysis.
Methods. Published articles reporting the performance of urine dipstick tests (leukocyte esterase [LE]
and/or nitrite), Gram stain, or microscopic analysis of
spun or unspun urine in the diagnosis of UTI in children
<12 years of age. Articles were identified through a comprehensive MEDLINE search, and those articles meeting
a priori inclusion criteria were selected. Eligibility criteria included the use of urine culture as the reference
standard, independent comparison of urine culture with
the results of one of the screening tests, definition of
positive screening test results provided, only pediatric
patients included or evaluable separately, and both gold
standard and screening test performed on all patients.
For each test, heterogeneity of reported sensitivity and
specificity of all studies was determined. The subgroups
of studies with similar definitions of UTI and age of
study subjects were analyzed separately to account for
some of the differences in reported results. When significant unexplained heterogeneity among studies precluded simple combining of results, a summary receiver–
operator characteristic curve was fitted for each screening
test, from which pooled estimates of true-positive rate
(TPR; ie, sensitivity) and false-positive rate (FPR; 1-specificity) were calculated.
Primary Results. A total of 1489 titles were identified
by the MEDLINE search; 26 articles met all criteria for
inclusion. There was significant heterogeneity among
studies for nearly all tests for both TPR and FPR, which
was explained only partially by the stringency of the
definition of UTI or age of subjects studied. Based on the
pooled estimates, the presence of any bacteria on Gram
stain on an uncentrifuged urine specimen had the best
combination of sensitivity (0.93) and FPR (0.05). Urine
dipstick tests performed nearly as well, with a sensitivity
of 0.88 for the the presence of either LE or nitrite and an
FPR of 0.04 for the presence of both LE and nitrite. Pyuria
had lower TPR and higher FPR: for presence of >5 white
blood cells/high-power field in a centrifuged urine sample, the TPR was 0.67 and the FPR was 0.21, whereas for
>10 white blood cells per mm3 in uncentrifuged urine,
the TPR was 0.77 and the FPR was 0.11.
From the *Division of Emergency Medicine, A. I. duPont Hospital for
Children, Wilmington, Delaware; the ‡Division of Emergency Medicine,
Children’s Hospital of Philadelphia, Philadelphia, Pennsylvania; and the
§Department of Pediatrics and the Center for Clinical Epidemiology and
Biostatistics, University of Pennsylvania School of Medicine, Philadelphia,
Pennsylvania.
Received for publication Oct 12, 1998; accepted May 17, 1999.
Reprint requests to (M.H.G.) the Division of Emergency Medicine, A. I.
duPont Hospital for Children, 1600 Rockland Rd, Wilmington, DE 19899.
E-mail: mgorelic@nemours.org
PEDIATRICS (ISSN 0031 4005). Copyright © 1999 by the American Academy of Pediatrics.
Conclusions. Both Gram stain and dipstick analysis
for nitrite and LE perform similarly in detecting UTI in
children and are superior to microscopic analysis for
pyuria. Pediatrics 1999;104(5). URL: http://www.
pediatrics.org/cgi/content/full/104/5/e54; urinary tract infection, diagnostic tests, urinalysis, pyuria, bacteriuria,
meta-analysis.
ABBREVIATIONS. UTI, urinary tract infection; LE, leukocyte esterase; WBC, white blood cells; hpf, high-power field; TPR, truepositive rate; FPR, false-positive rate; ROC, receiver– operator
characteristic; LR, likelihood ratio.
U
rinary tract infection (UTI) is recognized increasingly as a common cause of fever in
young children.1–3 However, clinical findings
indicative of UTI in this group are often subtle and
nonspecific, with fever often the only finding. On the
one hand, identification of very low risk children
would be desirable to reduce the cost of unnecessary
urine culture. Conversely, clinicians would like to be
able to identify those children with a sufficiently
high likelihood of UTI to begin presumptive treatment while waiting for the results of the urine culture.
Several rapid screening tests are used commonly
to make a presumptive diagnosis of UTI, including
dipstick biochemical analysis of urine for nitrites or
leukocyte esterase (LE), as well as microscopic examination of urine for formed elements including white
blood cells (WBC) or bacteria. Numerous studies
have been published concerning the usefulness of
these tests in diagnosing UTI.4,5 Many of these studies have been performed in adult patients, in whom
the diagnostic utility of the tests may differ.5,6 Moreover, even among pediatric studies the results differ
frequently.5,7 Therefore, the clinician is left with little
guidance regarding the optimal choice of diagnostic
tests for diagnosing UTI in children. In this situation,
meta-analysis, the structured review and statistical
combination of the results of existing research, may
be useful for identifying sources of variability among
studies and for providing an overall estimate of diagnostic accuracy.
Hurlbut et al4 published a meta-analysis of studies
of rapid dipstick tests in adult patients. Regarding
pediatric studies, although informal reviews of diagnostic tests exist,5,6 we are aware of no previous
attempt to synthesize the existing data in a structured, critical manner. The purpose of this study was
to perform a systematic review of the published literature to identify studies of rapid diagnostic tests
for UTI in children. We then used the techniques of
http://www.pediatrics.org/cgi/content/full/104/5/e54
PEDIATRICS Vol. 104 No. 5 November 1999
Downloaded from by guest on March 6, 2016
1 of 7
meta-analysis to derive overall estimates of test characteristics (sensitivity and specificity) from the existing studies where possible and to investigate the
sources of discrepancies among studies.8,9
METHODS
Identification of Relevant Literature
We used the National Library of Medicine’s PUBMED system
to conduct a MEDLINE search for the years 1966 to 1998 for
articles published in English, concerning the use of rapid diagnostic tests for UTI in children. The search strategy used was:
(urine [mh] or urinalysis [mh] or pyuria [mh] or reagent strips
[mh] or bacteriuria [mh])
and ((urinary tract infections [mh] or pyelonephritis [mh]) not
schistosomiasis [mh])
and (english [la])
and (infant, newborn [mh] or infant [mh] or child, preschool
[mh] or child [mh]),
where [mh] designates a Medical Subjects Heading term. The age
qualifiers chosen identify entries dealing with children from birth
through 12 years of age. In addition to the MEDLINE search, the
reference lists of those studies selected for inclusion and of review
articles known to the investigators were searched for other relevant references. The investigators also hand-searched their files
and contacted experts in the field to inquire about other studies
not identified by the MEDLINE search.
The titles and abstracts were reviewed by both authors for
possible relevance, with discrepancies resolved by discussion and
consensus. Those articles deemed relevant were retrieved and
reviewed. Inclusion criteria included:
• primary data (not review of existing studies)
• use of one or more of the following rapid tests:
urine dipstick (LE, nitrite, or both) microscopic analysis of centrifuged urine sample for WBC, reported as number of WBC per high
powered field (WBC/hpf) microscopic analysis of uncentrifuged
urine sample for WBC, reported as number of WBC per mm3
Gram stain of uncentrifuged urine
enhanced urinalysis10 (cell count and Gram stain on uncentrifuged urine)
• quantitative or semiquantitative urine culture as reference standard
• both screening test and urine culture performed on all subjects
• results of screening test not included in definition of UTI
• data presented in format allowing crosstabulation of results of
screening test and reference standard
• if both children and adults were included in study, results for
children evaluable separately
• data not included in another published report (in cases in which
multiple publications used the same subjects, we included the
one publication with the greatest number of subjects).
Each included article then was read in detail, and the results
were abstracted. For each article, information was abstracted on
the age of subjects, colony count used to define UTI, whether a
general or a special population (eg, urology clinic, only boys, etc)
was used, and any possible methodologic concerns (eg, nonconsecutive patient enrollment or nonblinded assessment).
For each test, a 2 3 2 table was abstracted as follows:
UTI
no UTI
positive test result
true positive
false positive
negative test result
false negative
true negative
In the case of a test with multiple possible thresholds (eg, for
microscopic analysis of uncentrifuged urine, $10 WBC/mm3, $50
WBC/mm3, and $100 WBC/mm3), separate tables were abstracted for each cutoff described in the study. Separate tables also
were constructed if test results for different age subgroups or with
different definitions of UTI were available in a single study.
Combining Results of Studies
For each test and at each cutoff of positivity, the true-positive
rate (TPR) and false-positive rate (FPR; 1-specificity) were determined individually from each included study. In meta-analysis,
2 of 7
the goal is to combine results from different studies to obtain a
more precise estimate than is possible from any of the individual
studies. The simplest means of combing results is simply to pool
raw data from all the included studies, yielding a weighted average for TPR and FPR.9 However, an important methodologic
consideration is whether differences in results among studies of a
given test are deemed to represent simply random differences
attributable to sampling variation or whether such differences
arise because of underlying heterogeneity in the studies.11 In the
presence of residual unexplained heterogeneity of results among
studies, simple summarization violates the underlying assumption that differences among studies are attributable simply to
random variation and may produce misleading or inaccurate results.12 Thus, for each diagnostic test of interest, separate comparisons of the TPRs and FPRs of all studies were performed using
the Pearson x2 test.9
To explore the possible sources of any heterogeneity among
studies (as indicated by P , .05 for the x2 test), the studies were
divided into subgroups. The first subgroup was defined based on
the definition of UTI used. Studies that defined UTI based on a
colony count of $105 colonies/mL for clean catch specimens, $104
colonies/mL for catheterized specimens, or only specimens obtained by suprapubic bladder aspiration were classified as using a
more stringent definition of UTI; those using lower thresholds for
positive culture results were classified as less stringent. If the
criterion for positive culture was not specified, the study was
included in the less stringent subgroup. In some cases, a single
study used two alternative cutoffs for positive culture results,
allowing separate analyses for both definitions. In these instances,
the study was included twice, once in each subgroup. (These
studies are indicated in Table 1.) To examine whether the TPR of
a given screening test depends on the definition of UTI used, a
pooled estimate of TPR for each subgroup of studies examining
that screening test was calculated. These pooled TPRs then were
compared with a x2 test. Similarly, pooled FPRs for each subgroup
were calculated and compared.
A second subgroup analysis was based on the age of the
patients included: all ages of children or only children ,2 years of
age. When the age of patients was not reported, it was assumed
that all ages were included. Again, if a single study provided data
allowing separate analyses of all children and younger children, it
was included in both subgroups. For a given diagnostic test,
subgroup analyses were performed if at least three studies were
included in each subgroup.
It has been noted that, in the case of diagnostic tests, differences
among studies are characterized frequently by a trade-off between
sensitivity and specificity.8,9,13 When the results of individual studies are plotted graphically, they assume the shape of a receiver–
operator characteristic (ROC) curve. One possible source of heterogeneity leading to this trade-off is the implicit use of different
threshold values for positive results in different studies. This may
occur even when the same cutoff ostensibly is used. For instance,
in two studies of LE, even though both may consider any result
$11 to be positive, differences in the interpretation of the color on
the stick may lead to inherent variation in the positive results
cutoff. Differences in the patient populations with regard to the
spectrum or prevalence of disease also may lead to such an observed trade-off.14 To look for evidence of such a trade-off, the TPR
and FPR of each study were plotted against each other in a scatter
plot, and the Spearman correlation coefficient was calculated. A
summary ROC curve of all the studies then was created.13 The TPR
and FPR were converted to their logits, and the sum and difference of the logits were calculated. Equally weighted least squares
linear regression with the difference as the dependent variable and
sum as the independent variable was performed. The resulting
equation represents the logit form of the summary ROC curve
from which a pooled estimate of TPR and FPR can be obtained.
We computed a weighted average of the FPR from all included
studies by simply combining the raw data for FPRs and TPRs,
following the suggestion of Moses et al.13 From this pooled estimate of the FPR, the TPR was calculated from the summary ROC
curve equation. Positive and negative likelihood ratios (LRs) were
derived from the summary TPRs and FPRs.
All statistical analyses were performed using Stata version 5.0
(Stata Corp, College Park, TX). Unless otherwise noted, P , .05
was considered to indicate statistical significance.
SCREENING TESTS FOR URINARY TRACT INFECTION IN CHILDREN
Downloaded from by guest on March 6, 2016
TABLE 1.
Studies Included in Meta-analysis
Reference
Tests
Performed
# UTIs/Total
Specimens
Ages
Included
Method for
Obtaining Specimen
Definition of UTI
(Colonies/mL)
Setting*
Saxena, 1975 (15)
Robins, 1975 (16)
Fennell, 1977 (17)
C
C
Nitrite
96/140
51/237
39/182
4–12 y
Clean catch (CC)
Not reported CC (92%)
Not reported CC
Not reported
$105
$105
Sutedja, 1977 (18)
C, UA
52/139
Not reported CC
$105
Skelton, 1977 (19)
Nitrite, C
54/483
$105, pure growth
Laboratory
Referral clinic
Home/referral
clinic
Outpatient
Department
and Inpatient
ward
Pediatric clinic
Any growth
$105
$105
Pediatric clinic
Pediatric clinic
Pediatric clinic
$105, 1 or 2
organisms
$105, pure growth
.105 for CC
.104 for catheter
$105 for CC, any
growth for SPA
Outpatient clinic
and inpatient
ward
Laboratory
Laboratory
Boreland, 1986 (23)
Nitrite
67/536
Not reported CC, urine bag, or
suprapubic aspirate
(SPA)
Not reported SPA
Not reported Not reported
Not reported CC (88%), bag (5%),
catheter (7%)
0–14 y
Not reported
Cannon, 1986 (24)
Marsik, 1986 (25)
Nitrite, LE
Nitrite, LE
44/306
53/601
Not reported Not reported
0–21 y
CC, catheter
Powell, 1987 (26)
Nitrite
Pylkkänen, 1979 (20) C
Parija, 1981 (21)
C, UA, GS
Corman, 1982 (22)
C
Tahirovic, 1988 (27) Nitrite
Goldsmith, 1990 (28) Nitrite, LE, UA
Crain, 1990 (29)
UA
322/477
110/300
25/100
200/500
0–16 y
CC (92%), SPA (8%)
75/306
101/1010
33/442
0–14 y
0–18 y
0–8 wk
CC
CC, catheter
Catheter, bag, SPA
Not reported
CC (31%), bag (18%),
catheter (26%), SPA
(25%)
CC, catheter
Emergency
department
and follow-up
clinic
$105
Pediatric clinic
4
5
$10 , $10 †
Laboratory
$104 for bag, catheter Emergency
$102 for SPA
department
$105
Not reported
4
5
$10 , $10 †
Acute care clinic
Lejeune, 1991 (30)
Weinberg, 1991 (31)
Nitrite, LE
Nitrite, LE,
UA, GS
37/243
41/1019
0–18 mo
0–18 y
Shaw, 1991 (32)
Nitrite, LE, UA
45/491
Woodward, 1993
(33)
Lohr, 1993 (34)
Nitrite, LE
12/133
Hiraoka, 1994 (35)
Nitrite, LE
$105 for CC, $103 for Emergency
catheter
department
0–15 y
CC (86%), bag, catheter $105
Emergency
department
0–16 y
CC (88%), catheter
$102 for SPA, $103
Pediatric clinic
4
(11%), SPA (1%)
for catheter, $10
for CC
0–15 y
CC (50%), catheter
$105 for CC or bag, Not reported
(30%), bag (20%)
$103 for catheter
Not reported CC (70%), bag
Pure growth (colony Emergency
count not reported)
department
0–15 y
CC (62%), catheter
$105 for CC or bag, Not reported
$103 for catheter
0–6 mo
Catheter
.103
Emergency
department
0–2 y
Catheter
$5 3 104
Emergency
department
0–2 y
Catheter
$104
Emergency
department
Nitrite, LE, UA
102/689
22/92
Molyneux, 1995 (36) C
19/248
Hiraoka, 1995 (37)
C
23/89
Lockhart, 1995 (38)
GS
18/207
Hoberman, 1996 (39) C, GS
212/4253
Shaw, 1998 (7)
105/3873
Nitrite, LE, GS,
UA, C
0–19 y‡
LE indicates leukocyte esterase; UA, microscopic analysis of centrifuged urine; GS, Gram stain, C, cell count on uncentrifuged urine.
* Laboratory refers to study performed on all specimens submitted to a clinical laboratory with the source not reported.
† Data analyzed separately using two different definitions of UTI.
‡ Data also reported separately for children ,2 years of age.
RESULTS
The MEDLINE search yielded 1489 titles. Of
these, 57 articles were reviewed in detail, and 26
met all inclusion criteria (Table 1)7,15–39. No relevant
studies were identified from other sources. The
range of TPRs and FPRs for each of the tests reported by the studies is shown in Table 2. If a given
published study provided results separately for
different tests, these were included as independent
entries.
As indicated in Table 2, most of the tests showed
significant heterogeneity among studies in both TPR
and FPR. Figure 1A illustrates the performance of the
tests when grouped by UTI definition used in the
study (more stringent or less stringent) for those tests
with enough studies with different definitions of UTI
to allow subgroup analyses. Studies with a more
stringent definition of UTI reported higher sensitivity (TPR) for LE alone and nitrite alone, but not for
microscopic urinalysis with $5 WBC/hpf. Similarly,
the FPR also differed by definition of UTI for LE
alone, nitrite alone, and the combination of any nitrite or LE on dipstick test. However, except for the
TPR for the LE test, the use of different definitions
http://www.pediatrics.org/cgi/content/full/104/5/e54
Downloaded from by guest on March 6, 2016
3 of 7
TABLE 2.
Diagnostic Test Characteristics From Published Studies
Test, Criterion for Positivity
Dipstick
Any nitrite only
Any LE only
Any nitrite or LE
Both nitrite and LE
Gram stain, any organisms
Microscopic analysis of centrifuged urine,
$5 WBC/hpf
Microscopic analysis of uncentrifuged urine,
$10 WBC/mm3
Number of
Studies*
FPR
Range
TPR
Range
Summary
Estimate of FPR†
Summary
Estimate of TPR‡
13
7
9
5
5
5
0, 0.05§
0.05, 0.29§
0.02, 0.24§
0, 0.05§
0, 0.13§
0.16, 0.23§
0.16, 0.72§
0.64, 0.89§
0.71, 1.0
0.14, 0.83§
0.80, 0.98§
0.55, 0.88§
0.02
0.16
0.07
0.04
0.05
0.21
0.50
0.83
0.88
0.72
0.93
0.67†
9
0.05, 0.63§
0.57, 0.92§
0.11
0.77
* A total of 26 studies were included; sum exceeds 26 because of the inclusion of some studies in analysis of more than one screening test.
† Pooled estimate from combining all studies with more stringent definition of UTI.
‡ Estimated TPR at summary FPR, derived from summary ROC curve based on studies with more stringent definition of UTI.
§ P , .05 for x2 test of heterogeneity.
Fig 1. Subgroup analysis of TPR and FPR from included studies. A, Studies with more stringent criteria for UTI (open circles) and less
stringent criteria (shaded circles). B, Studies including children of all ages together (open circles) and those including only children ,2
years of age (shaded circles). The horizontal line in each group represents the weighted average of the studies in that group. Tests with
a significant difference in pooled TPR or FPR among subgroups (P , .05 by x2 test) are indicated by an asterisk.
did not explain all the heterogeneity of results
among studies, shown by the wide range of values
and statistically significant heterogeneity within each
subgroup (more stringent vs less stringent definition
of UTI) depicted in Fig 1A. Thus, differences in the
gold standard used by different studies explain
some, but not all, of the observed heterogeneity in
results.
Analysis by age of patients is shown in Fig 1B.
Sensitivity results for the Gram stain and combined
dipstick tests were not different among age groups,
but the TPR of the presence of $10 WBC/mm3 was
significantly higher in the studies including only
children ,2 years of age. The pooled FPR was significantly lower for all three tests in studies of children ,2 years of age. With respect to both TPR and
FPR, all three diagnostic tests demonstrated significant heterogeneity within age groups. As with UTI
definition, differences in the age of the study subjects
do not explain adequately the variation in reported
results.
Because the variability among studies could not be
4 of 7
explained completely by differences in the age of
patients studied or by differences in the definition of
the reference standard, summary ROC curves were
constructed for each of the diagnostic tests. The summary ROC curves for the four dipstick tests are illustrated in Fig 2. Unlike conventional ROC curves,
which demonstrate the effect of altering the cutoff for
a positive test, these ROC curves show the trade-off
between TPRs and FPRs among different studies of
the same test with the same definition of a positive
test result. The ROC analysis also allowed us to
explore the possible effect of disease prevalence on
the performance of the screening test. When the proportion of patients with positive culture results was
included as a covariate in the ROC regression equations for nitrite, LE, Gram stain, and cell count, the
coefficients for the prevalence covariate were not
statistically significant (P . .3 in all cases).
Because the gold standard used to define UTI in
various studies did seem to contribute to the observed variability of results, we used an ROC curve
that excluded those few studies using low colony
SCREENING TESTS FOR URINARY TRACT INFECTION IN CHILDREN
Downloaded from by guest on March 6, 2016
Fig 2. Summary ROC curves for the dipstick tests
(solid lines). TPRs and FPRs are shown for studies
using more stringent criteria for UTI. Each circle represents the results of a single study. Positive LE is
defined as any result of trace or greater.
counts for the definition of UTI to derive a summary
point estimate of TPR and FPR for each screening
test. Table 2 shows the pooled estimate for the FPR
for each test, and the summary estimate for the TPR
derived from the equation for the ROC curve at that
FPR. For microscopic analysis of centrifuged urine
($5 WBC/hpf), there was no apparent relationship
between TPR and FPR (Spearman R 5 20.17); therefore, a summary ROC curve could not be constructed. In this case, a simple pooled estimate of
TPR was calculated by combining the results of the
studies into a single table as for FPR.
The test with the best combination of sensitivity
and specificity was Gram stain (positive LR: 18.5;
negative LR: 0.07). Urine dipstick tests performed
nearly as well; the presence of both LE and nitrites
had a positive LR of 12.6, whereas the absence of
both LE and nitrite had a negative LR of 0.13
Only two studies were found that examined the
combination of Gram stain and cell count on uncentrifuged urine, referred to as enhanced urinalysis.7,39
Two other studies used the combination of cell count
and bacteria, but on an unstained specimen;16,40 of
these, one included only the disjunctive combination
($10 WBC/mm3 or any bacteria on Gram stain). For
the combination of $10 WBC/mm3 and any bacteria,
the TPR was significantly lower and the FPR was
significantly higher in the study that used an unstained specimen to detect bacteriuria than in the
two studies incorporating Gram stain. The pooled
FPR for the latter two studies was 0.01 and the TPR
was 0.85, giving a positive LR of 85. For the combination of $10 WBC/mm3 or any bacteria, the TPR
was similar in all four studies, but the FPR was
significantly higher for the two studies that used
unstained specimens. Therefore, the pooled estimates were derived from the two studies using Gram
stain, yielding a summary TPR of 0.95, FPR of 0.11,
and negative LR of 0.06.
DISCUSSION
This systematic review of the literature identified a
number of studies reporting on the performance of
various screening tests to detect UTI in children.
Even among the most methodologically sound papers, there is substantial variability in the reported
sensitivity and specificity. Using meta-analytic methods, we were able to examine some of the reasons for
this variability and to summarize the results of different studies to guide clinicians in interpreting the
available tests.
For predicting a positive urine culture, the presence of any bacteria on a Gram-stained urine specimen offers the best combination of sensitivity and
specificity, with the highest sensitivity of the tests
evaluated. However, the dipstick test performs
nearly as well, with a slightly lower sensitivity for
the presence of any nitrite or LE and a slightly better
FPR for the presence of both LE and nitrite. The
technically more demanding microscopic analysis of
either centrifuged or uncentrifuged urine offers no
advantage over the dipstick test or Gram stain, with
lower sensitivity and specificity. The enhanced urinalysis, a combination of Gram stain and cell count
performed in a counting chamber using an uncentrifuged urine specimen, also seems to provide an excellent combination of sensitivity and specificity.
However, this is based on only two studies, both of
which were performed in children ,2 years of age.
Moreover, in these two studies the accuracy of the
http://www.pediatrics.org/cgi/content/full/104/5/e54
Downloaded from by guest on March 6, 2016
5 of 7
cell count component alone was substantially better
than for the other studies using counting chamber
cell count on uncentrifuged urine. Therefore, the results of these two studies should be interpreted with
caution.
Some of the differences in results among studies
were explained by identifiable differences in the
methods used by the individual studies. For example, when we analyzed studies separately according
to the definition of UTI used, we found that studies
using a more stringent reference standard generally
had different results than those using a lower colony
count to define a positive culture. The use of more
stringent criteria probably eliminates some contaminated cultures that are less likely to have pyuria or to
contain pathogenic species that produce nitrites.
Both of these factors would reduce the number of
false-negative results when a more stringent gold
standard is applied, which may explain the improved sensitivity of the LE and nitrite tests in this
group of studies. However, using a higher colony
count cutoff also will lead to misclassifying some
patients who actually have UTI (with pyuria and
nitrites) as not having the disease. Such misclassification can explain the higher FPRs for nitrite and LE
alone among studies with more stringent definitions.
Because the choice of gold standard affects the reported accuracy of the tests, we chose to calculate our
summary estimates of sensitivity and specificity
from only those studies using the more stringent
colony counts used to define UTI; this corresponds
with the definition of UTI that is accepted most
widely.
The age of the patients was also a factor in the
performance of the screening tests. There are several
potential explanations for the observed differences.
More frequent voiding in non-toilet-trained infants
leads to decreased time for production of nitrites by
nitrate-reducing organisms, while such infants might
tend to have a less vigorous inflammatory response
to infection, which may explain the lower sensitivity
of the dipstick test for LE or nitrites. Differences in
the usual means of specimen collection (clean catch
for older children vs urine bag or urethral catheterization for infants) that would lead to differences in
the potential for contamination of the specimen with
perineal cells and bacteria may contribute to the
lower FPR observed in the younger children. Similarly, proportionately fewer contaminated specimens
in these younger children would tend to exclude
those with a false-positive culture and no pyuria, and
lead to a higher TPR for tests that detect small
amounts of pyuria, such as the microscopic examination of urine using a counting chamber.
Even accounting for differences in the gold standard and age of the study populations, there remained significant differences among studies in the
reported sensitivity and specificity of most of the
screening tests. We were able to generate summary
ROC curves for most of the tests, demonstrating that
different studies of a given screening test using the
same threshold for a positive result show the same
trade-off between true- and false-positive results as
would be expected if the various studies actually
6 of 7
used different thresholds. Other factors such as differences in the techniques of the test performance,
characteristics of the patient populations, and differences in disease prevalence can cause such a relationship between TPRs and FPRs. We did not find that
UTI prevalence had an effect on the results. However, it should be noted that almost all the studies
used some form of convenience sampling; thus, the
proportion of positive cultures in the study sample
that we used in our analysis is not necessarily a
reflection of the disease prevalence in the population.
Although we were not able to examine this and the
other factors above directly because of incomplete
information in the studies, by using the ROC curves,
it was possible to obtain summary estimates of the
TPR and FPR, adjusting for at least some of these
unmeasured differences among studies.
Although the resulting summary ROC curves allow for a more meaningful comparison of different
tests across a range of implicit thresholds which will
be useful to the clinician, a single point on the curve
must be chosen to select a value for sensitivity and
specificity to be used in decision making. We used
the simple pooled estimate of FPR from all studies to
define the operating point of interest on the curve
and derived the summary TPR from the ROC curve
at that point. For many of the diagnostic tests we
evaluated, such as nitrite alone or Gram stain, although the differences in FPRs among studies were
statistically significant, the range reported was actually quite small and the observed variability is likely
to have little clinical importance. In such cases, the
use of a simple weighted average for the summary
FPR estimate is justifiable despite the heterogeneity.
For the other tests (eg, LE alone), although the range
of FPR was substantial, the summary ROC curve
proved quite flat over the range of interest. The
choice of FPR in this case is unlikely to have an
important impact on the calculated value of TPR.
Nevertheless, the pooled FPR should be interpreted
with some caution.
Several other potential limitations to this study are
common to many meta-analyses. Although we used
a comprehensive search strategy to identify relevant
articles, some publications may have been missed,
particularly those published before 1966. Moreover,
only those studies actually published could be identified. Because studies with negative results (eg,
those showing poor diagnostic performance) are less
likely to be published, a phenomenon known as publication bias,12 the resulting meta-analysis may overestimate the accuracy of the tests in question. A bias
may be introduced by limiting searches to English
publications, although the importance of this bias is
unclear.12
Based on this systematic review of the existing
literature, we conclude that the urine dipstick test
and Gram stain perform similarly in detecting UTI in
children, with high sensitivity and a low FPR. The
enhanced urinalysis may offer a better combination
of test performance characteristics but has not yet
been well studied. All these tests have better sensitivity and specificity than the presence of pyuria in
either centrifuged or uncentrifuged specimen. In-
SCREENING TESTS FOR URINARY TRACT INFECTION IN CHILDREN
Downloaded from by guest on March 6, 2016
deed, the TPRs and FPRs of the presence of .5
WBC/hpf in a centrifuged urine specimen (standard
urinalysis) is sufficiently poor that it cannot be recommended for making a presumptive diagnosis of
UTI. The clinical usefulness of any of these tests will
depend on the clinical setting in which they are
applied, and, specifically, on the prevalence of the
disease, which will affect the predictive value of a
positive or negative result. Moreover, the choice of a
testing strategy must be based on balancing a number of other considerations such as availability and
cost of the tests themselves,7 as well as the relative
costs of failing to diagnose a UTI in a child with a
false-negative test result versus unnecessary treatment of an otherwise healthy child with a falsepositive test result. Currently, we are undertaking a
decision analysis to define further the optimal testing
strategy for diagnosing UTI in children.
15.
16.
17.
18.
19.
20.
21.
22.
23.
ACKNOWLEDGMENT
This work was supported by Grant MCJ-420648 from the Maternal and Child Health Bureau (Title V, Social Security Act),
Health Resources and Services Administration, Department of
Health and Human Services.
24.
25.
REFERENCES
1. Shaw KN, Gorelick MG, McGowan KL, McDaniel Yakscoe M, Schwartz
JS. Prevalence of urinary tract infection in febrile young children in the
emergency department. Pediatrics.1998;102(2). URL: http://
www.pediactrics.org/cgi/content/full/102/2/e16
2. Hoberman A, Han-Pu C, Keller DM, Hickey R, Davis HW, Ellis D.
Prevalence of urinary tract infection in febrile infants. J Pediatr. 1993;
123:17–23
3. Bauchner H, Phillipp B, Dashefsky B, Klein JO. Prevalence of bacteriuria
in febrile children. Pediatr Infect Dis J. 1987;6:239 –242
4. Hurlbut TA, Littenberg B, and the Diagnostic Technology Assessment
Consortium. The diagnostic accuracy of rapid dipstick tests to predict
urinary tract infection. Am J Clin Pathol. 1991;96:582–588
5. Lohr JA. Use of routine urinalysis in making a presumptive diagnosis of
urinary tract infection in children. Pediatr Infect Dis J. 1991;10:646 – 650
6. Todd JK. Diagnosis of urinary tract infections. Pediatr Infect Dis J.
1982;1:126 –131
7. Shaw KN, McGowan KL, Gorelick MH, Schwartz JS. Screening for
urinary tract infection in infants in the emergency department: which
test is best? Pediatrics 1998;101(6). URL: http://www.pediatrics.org/
cgi/content/full/101/6/e1
8. Irwig L, Tosteson ANA, Gatsonis C, et al. Guidelines for meta-analyses
evaluating diagnostic tests. Ann Intern Med. 1994;120:667– 676
9. Midgette AS, Stukel TA, Littenberg B. A meta-analytic method for
summarizing diagnostic test performance: receiver-operatingcharacteristic summary point estimates. Med Decis Making. 1993;13:
253–257
10. Hoberman A, Wald ER, Penchasky L, Reynolds EA, Young S. Enhanced
urinalysis as a screening test for urinary tract infection. Pediatrics. 1993;
91:1196 –1199
11. Shapiro DE. Issues in combining independent estimates of the sensitivity and specificity of a diagnostic test. Acad Radiol.1995;2:37– 47. Supplement
12. Pettitti DB. Meta-analysis, Decision Analysis, and Cost-effectiveness
Analysis: Methods for Quantitative Synthesis in Medicine. New York, NY:
Oxford University Press; 1994:52–53, 90 –95
13. Moses LE, Shapiro D, Littenberg B. Combining independent studies of
a diagnostic test into a summary ROC curve: data-analytic approaches
and some additional considerations. Stat Med. 1993;12:1293–1316
14. Lachs MS, Nachamkin I, Edelstein PH, Goldman J, Feinstein AR,
26.
27.
28.
29.
30.
31.
32.
33.
34.
35.
36.
37.
38.
39.
40.
Schwartz JS. Spectrum bias in the evaluation of diagnostic tests: lessons
from the rapid dipstick test for urinary tract infection. Ann Intern Med.
1992;117:135–140
Saxena H, Ajwani KD, Mehrotra D. Quantitative pyuria in the diagnosis
of urinary tract infections in children. Indian J Pediatr. 1975;42:35–38
Robins DG, White RHR, Rogers KB, Osman MS. Urine microscopy as an
aid to detection of bacteriuria. Lancet. 1975;2:476 – 478
Fennell RS, Wilson SG, Garin EH, et al. The combination of two screening methods in a home culture program for children with recurrent
bacteriuria. Clin Pediatr. 1977;16:951–955
Sutedja J, Said M, Alatas H, Wilawirja IGN. Correlation of quantitative
leucocyte count and urinary tract infection. Paediatr Indones. 1977;17:
168 –172
Skelton IJ, Hogan MM, Stokes B, Hurst JA. Urinary tract infections in
childhood: the place of the nitrite test. Med J Aust. 1977;1:882– 886
Pylkkänen J, Vilska J, Koskimies O. Diagnostic value of symptoms and
clean-voided urine specimen in childhood urinary tract infection. Acta
Paediatr Scand. 1979;68:341–344
Parija AC, Padhi M, Sen SK. Urinary tract infection: correlation of
pyuria, bacteriuria with urine culture. Indian J Pediatr. 1981;48:753–756
Corman LI, Foshee WS, Kotchmar GS, Harbison RW. Simplified urine
microscopy to detect significant bacteriuria. Pediatrics. 1982;70:133–135
Boreland PC, Stoker M. Dipstick analysis for screening of paediatric
urine. J Clin Pathol. 1986;39:1360 –1362
Canon HJ, Goetz ES, Hamoudi AC, Marcon MJ. Rapid screening and
microbiologic processing of pediatric urine specimens. Diagn Microbiol
Infect Dis. 1986;4:11–17
Marsik FJ, Owens D, Lewandowsi J. Use of the leukocyte esterase and
nitrite tests to determine the need for culturing urine specimens from a
pediatric and adolescent population. Diagn Microbiol Infect Dis. 1986;4:
181–183
Powell HR, McCredie DA, Ritchie MA. Urinary nitrite in symptomatic
and asymptomatic urinary infection. Arch Dis Child. 1987;62:138 –140
Tahirovic H, Paöic M. A modified nitrite test as a screening test for
significant bacteriuria. Eur J Pediatr. 1988;147:632– 633
Goldsmith BM, Campos JM. Comparison of urine dipstick, microscopy,
and culture for the detection of bacteriuria in children. Clin Pediatr.
1990;29:214 –218
Crain EF, Gershel JC. Urinary tract infection in febrile infants younger
than 8 weeks of age. Pediatrics. 1990;86:363–367
Lejeune B, Baron R, Guillois B, Mayeux D. Evaluation of a screening test
for detecting urinary tract infection in newborns and infants. J Clin
Pathol. 1991;44:1029 –1030
Weinberg AG, Gan VN. Urine screen for bacteriuria in symptomatic
pediatric outpatients. Pediatr Infect Dis J. 1991;10:651– 654
Shaw KN, Hexter D, McGowan KL, Schwartz JS. Clinical evaluation of
a rapid screening test for urinary tract infections in children. J Pediatr.
1991;118:733–736
Woodward MN, Griffiths DM. Use of dipsticks for routine analysis of
urine from children with abdominal pain. Br Med J. 1993;306:1512
Lohr JA, Portila MG, Geuder TG, Dunn ML, Dudley SM. Making a
presumptive diagnosis of urinary tract infection by using a urinalysis
performed in an on-site laboratory. J Pediatr. 1993;122:22–25
Hiraoka M, Hida Y, Hori C, Tsuchida S, Kuroda M, Sudo M. Rapid
dipstick test for diagnosis of urinary tract infection. Acta Paediatr Japon.
1994;36:379 –382
Molyneux EM, Robson WJ. A dipstick test for urinary tract infections. J
Accid Emerg Med. 1995;12:191–193
Hiraoka M, Hida Y, Hori C, Tsuchida S, Kuroda M, Sudo M. Urine
microscopy on a counting chamber for diagnosis of urinary infection.
Acta Paediatr Japon 1995;37:27–30
Lockhart GR, Lewander WJ, Cimini DM, Josephson SL, Linakis JG. Use
of urinary Gram stain for detection of urinary tract infection in infants.
Ann Emerg Med. 1985;25:31–35
Hoberman A, Wald ER, Reynolds EA, Penchavsky L, Charron M. Is
urine culture necessary to rule out urinary tract infection in young
febrile children? Pediatr Infect Dis J. 1996;15:304 –309
Pylkkänen J, Vilska J, Koskimies O. Scoring of urinary findings as an aid
in diagnosis for childhood urinary tract infection. Acta Paediatr Scand.
1981;70:875– 878
http://www.pediatrics.org/cgi/content/full/104/5/e54
Downloaded from by guest on March 6, 2016
7 of 7
Screening Tests for Urinary Tract Infection in Children: A Meta-analysis
Marc H. Gorelick and Kathy N. Shaw
Pediatrics 1999;104;e54
Updated Information &
Services
including high resolution figures, can be found at:
/content/104/5/e54.full.html
References
This article cites 36 articles, 11 of which can be accessed free
at:
/content/104/5/e54.full.html#ref-list-1
Citations
This article has been cited by 16 HighWire-hosted articles:
/content/104/5/e54.full.html#related-urls
Subspecialty Collections
This article, along with others on similar topics, appears in
the following collection(s):
Urology
/cgi/collection/urology_sub
Genitourinary Disorders
/cgi/collection/genitourinary_disorders_sub
Permissions & Licensing
Information about reproducing this article in parts (figures,
tables) or in its entirety can be found online at:
/site/misc/Permissions.xhtml
Reprints
Information about ordering reprints can be found online:
/site/misc/reprints.xhtml
PEDIATRICS is the official journal of the American Academy of Pediatrics. A monthly
publication, it has been published continuously since 1948. PEDIATRICS is owned, published,
and trademarked by the American Academy of Pediatrics, 141 Northwest Point Boulevard, Elk
Grove Village, Illinois, 60007. Copyright © 1999 by the American Academy of Pediatrics. All
rights reserved. Print ISSN: 0031-4005. Online ISSN: 1098-4275.
Downloaded from by guest on March 6, 2016
Screening Tests for Urinary Tract Infection in Children: A Meta-analysis
Marc H. Gorelick and Kathy N. Shaw
Pediatrics 1999;104;e54
The online version of this article, along with updated information and services, is
located on the World Wide Web at:
/content/104/5/e54.full.html
PEDIATRICS is the official journal of the American Academy of Pediatrics. A monthly
publication, it has been published continuously since 1948. PEDIATRICS is owned,
published, and trademarked by the American Academy of Pediatrics, 141 Northwest Point
Boulevard, Elk Grove Village, Illinois, 60007. Copyright © 1999 by the American Academy
of Pediatrics. All rights reserved. Print ISSN: 0031-4005. Online ISSN: 1098-4275.
Downloaded from by guest on March 6, 2016

