9.2
Describing “Average”
413
Comparing Population Pyramids
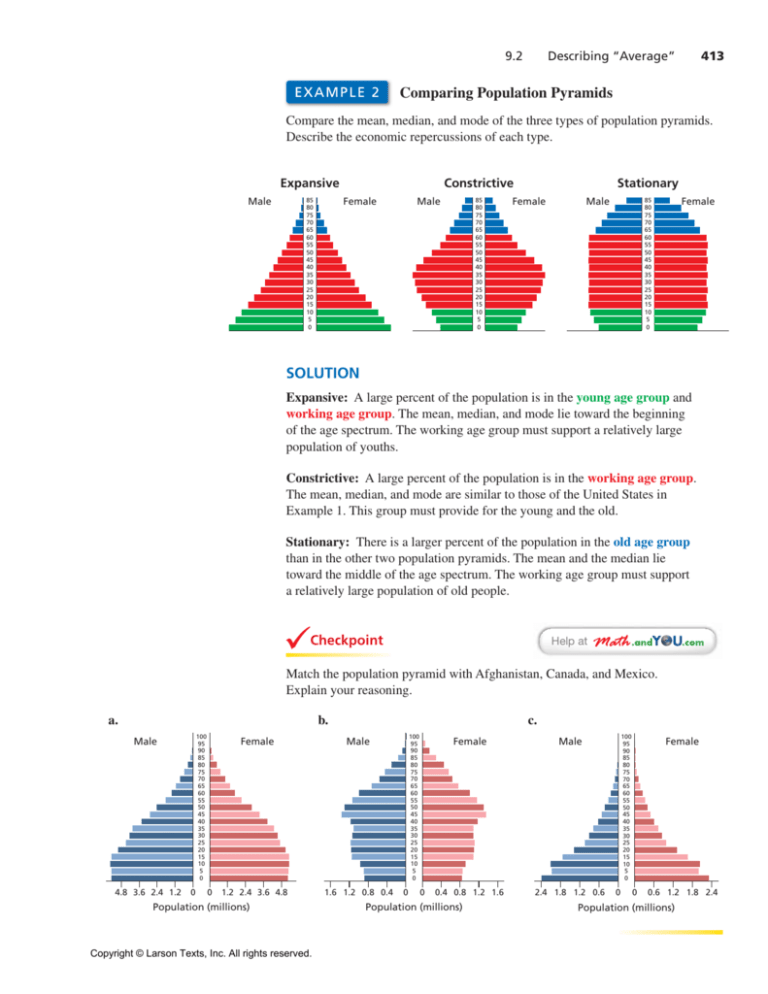
Compare the mean, median, and mode of the three types of population pyramids.
Describe the economic repercussions of each type.
Expansive
Male
Constrictive
Female
85
80
75
70
65
60
55
50
45
40
35
30
25
20
15
10
5
0
Male
85
80
75
70
65
60
55
50
45
40
35
30
25
20
15
10
5
0
Stationary
Female
Male
Female
85
80
75
70
65
60
55
50
45
40
35
30
25
20
15
10
5
0
SOLUTION
Expansive: A large percent of the population is in the young age group and
working age group. The mean, median, and mode lie toward the beginning
of the age spectrum. The working age group must support a relatively large
population of youths.
Constrictive: A large percent of the population is in the working age group.
The mean, median, and mode are similar to those of the United States in
Example 1. This group must provide for the young and the old.
Stationary: There is a larger percent of the population in the old age group
than in the other two population pyramids. The mean and the median lie
toward the middle of the age spectrum. The working age group must support
a relatively large population of old people.
Checkpoint
Help at
Match the population pyramid with Afghanistan, Canada, and Mexico.
Explain your reasoning.
a.
b.
100
95
90
85
80
75
70
65
60
55
50
45
40
35
30
25
20
15
10
5
0
Male
4.8 3.6 2.4 1.2
0
Female
0
1.2 2.4 3.6 4.8
Population (millions)
Copyright © Larson Texts, Inc. All rights reserved.
c.
100
95
90
85
80
75
70
65
60
55
50
45
40
35
30
25
20
15
10
5
0
Male
1.6 1.2 0.8 0.4
0
0
Female
Male
0.4 0.8 1.2 1.6
2.4 1.8 1.2 0.6
Population (millions)
100
95
90
85
80
75
70
65
60
55
50
45
40
35
30
25
20
15
10
5
0
0
Female
0
0.6 1.2 1.8 2.4
Population (millions)


