SK277 Human Biology Page 1 of 2
advertisement

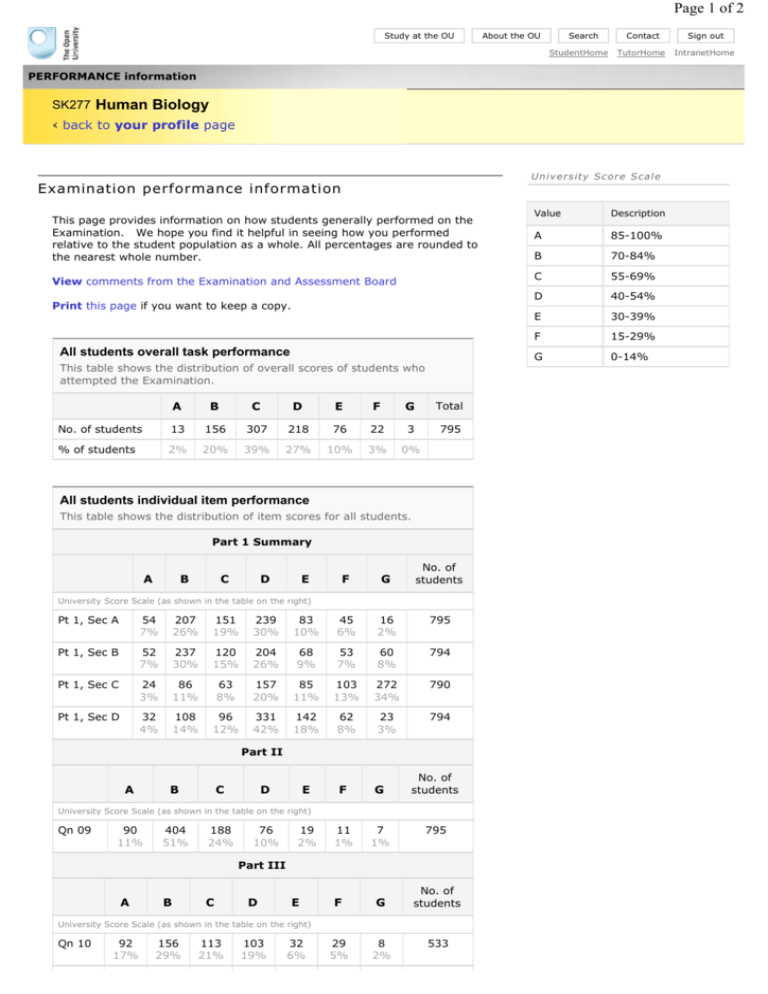
Page 1 of 2 skip to content Study at the OU About the OU Accessibility Search StudentHome Contact Sign out TutorHome IntranetHome PERFORMANCE information SK277 Human Biology ‹ back to your profile page U ni v e r s i ty S c o r e S ca l e Examination performance information This page provides information on how students generally performed on the Examination. We hope you find it helpful in seeing how you performed relative to the student population as a whole. All percentages are rounded to the nearest whole number. View comments from the Examination and Assessment Board Print this page if you want to keep a copy. All students overall task performance This table shows the distribution of overall scores of students who attempted the Examination. A B C D E F G Total No. of students 13 156 307 218 76 22 3 795 % of students 2% 20% 39% 27% 10% 3% 0% All students individual item performance This table shows the distribution of item scores for all students. Part 1 Summary A B C D E F G No. of students University Score Scale (as shown in the table on the right) Pt 1, Sec A 54 7% 207 26% 151 19% 239 30% 83 10% 45 6% 16 2% 795 Pt 1, Sec B 52 7% 237 30% 120 15% 204 26% 68 9% 53 7% 60 8% 794 Pt 1, Sec C 24 3% 86 11% 63 8% 157 20% 85 11% 103 13% 272 34% 790 Pt 1, Sec D 32 4% 108 14% 96 12% 331 42% 142 18% 62 8% 23 3% 794 F G 11 1% 7 1% Part II A B C D E No. of students University Score Scale (as shown in the table on the right) Qn 09 90 11% 404 51% 188 24% 76 10% 19 2% 795 Part III A B C D E F G 29 5% 8 2% No. of students University Score Scale (as shown in the table on the right) Qn 10 92 17% 156 29% 113 21% 103 19% 32 6% 533 Value Description A 85-100% B 70-84% C 55-69% D 40-54% E 30-39% F 15-29% G 0-14% Page 2 of 10% 19% 10% 19% 12% 21% 10% Qn 12 3 5% 7 13% 14 25% 9 16% 5 9% 12 22% 5 9% 55 Qn 13 6 4% 27 18% 32 21% 43 28% 27 18% 15 10% 2 1% 152 ^ back to top Examination and Assessment Board comments Thank you for studying SK277. We hope you found the course interesting and beneficial. Below, we have identified the major points arising from the examination. We hope you find this feedback helpful. PART I Section A Most students answered this well although, in Q1, a substantial minority failed to identify any physiological reason why it might be difficult to bring about weight reduction in the overweight child but gave both a psychological and a sociological reason instead. Although a few students confused the thrifty genotype with the thrifty phenotype hypothesis in Q2, the principle of the programming hypothesis was generally well explained. Section B Q3 asked you to explain the inter-relationships of the sympathetic and parasympathetic nervous system. The best answers to this were couched in terms of homeostatic principles. In Q4, the description of venous return as a function of muscle activity was often sketchy. The best answers had diagrams to show how the muscle encircled the vein. Section C This was the section in Part I that students generally found the most challenging. In Q5, many students described the structure of the kidney when the question asked about the structure of the filtration membrane. And in Q6 there were numerous accounts of adaptive immunity whereas the question was about innate immunity. As there had been a TMA question based on the immunology chapter it was disappointing that this was a common mistake. Section D Q7 was again a question with the same focus as a TMA question so it was a disappointment that the details of IVF treatment were poorly recalled. Q8 demonstrated that the signs and symptoms of chronic stress were well known! Where students used flow diagrams to explain the relationship between stress and the secretion of corticosteroids, they usually established the principle effectively even if details were missing or inaccurate. PART II Question 9 The data-handling question was well answered with most students correctly noting that as exercise levels increase so do the rate of breathing and the tidal volume (c). Rather fewer made the observation that men were, in general, larger than women, hence their greater lung capacity (b). Nearly everyone gained marks for labelling the axes of their graphs and some students took the precaution of annotating their sketch to ensure the examiner knew what they were trying to represent, although the graph itself was usually quite clear. PART III Question 10 A popular question. Many excellent accounts. Question 11 Many accounts concentrated on describing the processes involved in the growth of bones but spent too little time on factors that affect growth. Question 12 A few excellent accounts but others barely mentioned homeostasis or the kidney’s homeostatic role. A description of kidney anatomy was not relevant for this question. Question 13 Some excellent information contained in many answers to this question. Sadly much of it was not directed at supporting or refuting the theories about the function of sleep. ‹ back to your profile page ^ back to top Privacy Copyright Accessibility News Alumni Research OU on TV © The Open University, Walton Hall, Milton Keynes MK76AA +44 (0)870 333 4340 Jobs Cymraeg general-enquiries@open.ac.uk


