Financial Highlights ( 47KB)
advertisement
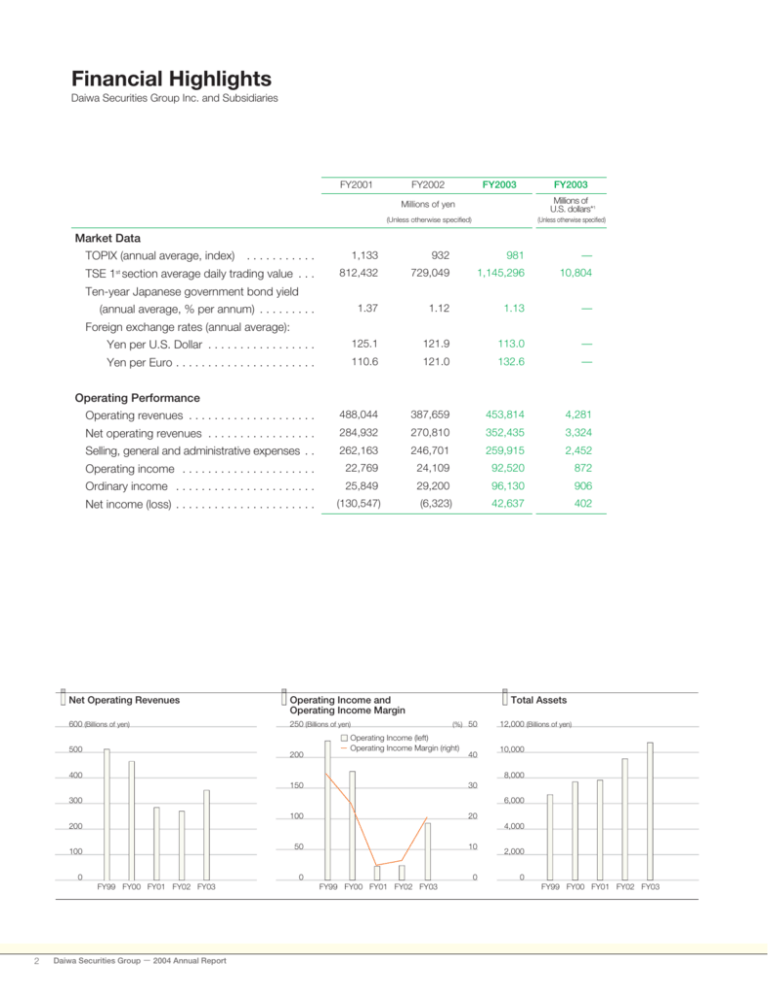
Financial Highlights Daiwa Securities Group Inc. and Subsidiaries FY2001 FY2002 FY2003 FY2003 Millions of yen Millions of U.S. dollars*1 (Unless otherwise specified) (Unless otherwise specified) Market Data ........... 1,133 932 981 — TSE 1 section average daily trading value . . . 812,432 729,049 1,145,296 10,804 1.37 1.12 1.13 — Yen per U.S. Dollar . . . . . . . . . . . . . . . . . 125.1 121.9 113.0 — Yen per Euro . . . . . . . . . . . . . . . . . . . . . . 110.6 121.0 132.6 — Operating revenues . . . . . . . . . . . . . . . . . . . . 488,044 387,659 453,814 4,281 Net operating revenues . . . . . . . . . . . . . . . . . 284,932 270,810 352,435 3,324 Selling, general and administrative expenses . . 262,163 246,701 259,915 2,452 Operating income . . . . . . . . . . . . . . . . . . . . . 22,769 24,109 92,520 872 Ordinary income . . . . . . . . . . . . . . . . . . . . . . 25,849 29,200 96,130 906 Net income (loss) . . . . . . . . . . . . . . . . . . . . . . (130,547) (6,323) 42,637 402 TOPIX (annual average, index) st Ten-year Japanese government bond yield (annual average, % per annum) . . . . . . . . . Foreign exchange rates (annual average): Operating Performance Net Operating Revenues Operating Income and Operating Income Margin 600 (Billions of yen) 250 (Billions of yen) 500 200 Total Assets (%) 50 Operating Income (left) Operating Income Margin (right) 40 400 10,000 8,000 150 30 100 20 300 6,000 200 4,000 50 100 10 0 0 FY99 FY00 FY01 FY02 FY03 2 12,000 (Billions of yen) Daiwa Securities Group − 2004 Annual Report 0 FY99 FY00 FY01 FY02 FY03 2,000 0 FY99 FY00 FY01 FY02 FY03 FY2001 FY2002 FY2003 FY2003 Millions of U.S. dollars*1 Millions of yen Balance Sheet Total assets . . . . . . . . . . . . . . . . . . . . . . . . . . 7,827,306 9,502,826 10,765,665 101,562 Total risk assets * . . . . . . . . . . . . . . . . . . . 541,364 422,019 371,294 3,502 Total shareholders’ equity . . . . . . . . . . . . . . . 570,839 541,719 604,170 5,699 2 Yen Per Share Data U.S. dollars (98.27) (4.75) 31.66 0.30 ............. 429.68 407.84 453.60 4.28 Cash dividends . . . . . . . . . . . . . . . . . . . . . . . 6.0 6.0 10.0 0.09 Net Income (loss) * . . . . . . . . . . . . . . . . . . . . 3 Total shareholders’ equity * 3 % Financial Ratios Return on Equity (ROE) *4 . . . . . . . . . . . . . . . . — — 7.4 Equity ratio . . . . . . . . . . . . . . . . . . . . . . . . . . 7.3 5.7 5.6 11,483 11,559 11,565 Other data Total number of employees . . . . . . . . . . . . . . *Notes: 1. Translations of the Japanese yen amounts into U.S. dollars are made at the rate of ¥106.00 per U.S. dollar, solely for the convenience of readers. 2. Risk assets are calculated as the sum of operational investment securities, tangible fixed assets and investment securities. 3. Net income (loss) and shareholders’ equity per share are computed based on the average number of shares outstanding during the year. 4. ROE is computed based on the average shareholders’ equity at the beginning and end of the fiscal year. 5. Simple comparisons across the years cannot be made due to changes in items made to accommodate changes in statutory accounting standards. Some of the main changes are as following. • We have adopted the “Accounting Standard for Employees’ Severance and Pension Benefits” in FY2000. We have also adopted the “Accounting Standards for Financial Instruments” resulting in the evaluation changes from mark-to-market valuations minus any tax effects of other securities to be included in stockholders’ equity as “Net unrealized gain on securities net of tax effects.” Furthermore, “translation adjustments” which were previously recorded on the asset side has been moved to shareholders’ equity. • The operating results are presented in accordance with the amended “Uniform Accounting Standards of Securities Companies” (set by the board of directors of the Japan Securities Dealers’ Association, September 28, 2001) since FY2001. Therefore figures for FY1999 and FY2000 have been adjusted according to the amended standards. Shareholders' Equity vs. Risk Assets Net Income (Loss) and Return on Equity 800 (Billions of yen) Risk Assets 150 (Billions of yen) Net Income (Loss) (left) Return on Equity (right) 100 Shareholders' Equity Net Operating Revenues per Employee (%)30 20 50 (Millions of yen) 40 600 50 10 0 0 -50 -10 -100 -20 30 400 20 200 0 -150 FY99 FY00 FY01 FY02 FY03 Financial Highlights -30 FY99 FY00 FY01 FY02 FY03 10 0 FY99 FY00 FY01 FY02 FY03 3
