Climate is a long-term weather pattern.
Page 1 of 7
KEY CONCEPT
Climate is a long-term weather pattern.
BEFORE, you learned
• The Sun’s energy heats Earth’s surface unevenly
• The atmosphere’s temperature changes with altitude
• Oceans affect wind flow
NOW, you will learn
• How climate is related to weather
• What factors affect climate
• About seasonal patterns of temperature and precipitation
VOCABULARY climate p. 117 latitude p. 118 marine climate p. 120 continental climate p. 120 ocean current p. 121 season p. 122
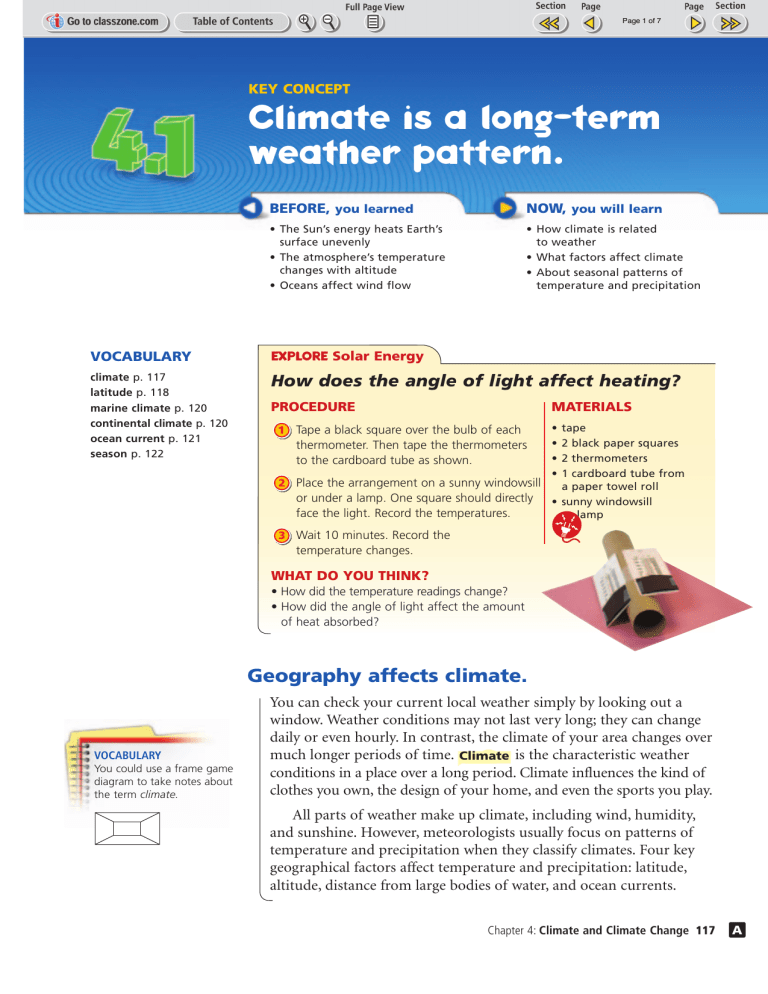
EXPLORE Solar Energy
How does the angle of light affect heating?
PROCEDURE
1
2
MATERIALS
Tape a black square over the bulb of each thermometer. Then tape the thermometers to the cardboard tube as shown.
Place the arrangement on a sunny windowsill or under a lamp. One square should directly face the light. Record the temperatures.
• tape
• 2 black paper squares
• 2 thermometers
• 1 cardboard tube from a paper towel roll
• sunny windowsill or lamp
3 Wait 10 minutes. Record the temperature changes.
WHAT DO YOU THINK?
• How did the temperature readings change?
• How did the angle of light affect the amount of heat absorbed?
VOCABULARY
You could use a frame game diagram to take notes about the term climate.
Geography affects climate.
You can check your current local weather simply by looking out a window. Weather conditions may not last very long; they can change daily or even hourly. In contrast, the climate of your area changes over much longer periods of time.
Climate is the characteristic weather conditions in a place over a long period. Climate influences the kind of clothes you own, the design of your home, and even the sports you play.
All parts of weather make up climate, including wind, humidity, and sunshine. However, meteorologists usually focus on patterns of temperature and precipitation when they classify climates. Four key geographical factors affect temperature and precipitation: latitude, altitude, distance from large bodies of water, and ocean currents.
Chapter 4: Climate and Climate Change 117
Page 2 of 7
Latitude and Temperature
–10
°
C
–5
°
C
–15
°
C
–10
°
C
50 ° N
0
°
C
5
°
C
10
°
C
–5
°
C
0
°
C
60
°
N
N
W
E
S
50 ° N
5
°
C
5
°
C
40 ° N
40
°
N
10
°
C
15
°
C
20
°
C
30
°
N
15
°
C
20
°
C
30 ° N
0 250 500 miles
0 250 500 kilometers
20
°
C
20 ° N
25
°
Tropic of Cancer
C
25
°
C
20 ° N
25 ° C
This map shows average annual temperatures in North America. Average temperatures generally decrease as you move away from the equator into higher latitudes.
Average Annual
Temperatures
–15°C (5°F)
–10°C (14°F)
–5°C (23°F)
0°C (32°F)
5°C (41°F)
10°C (50°F)
15°C (59°F)
20°C (68°F)
25°C (77°F)
Equator
90
°
N
90
°
S
60
°
N
30
°
N
0
°
60
°
S
30
°
S
Latitude
Notice on the globe in the illustration that latitude numbers get higher as you move away from the equator.
Latitude
One factor that affects temperature is latitude.
Latitude is the distance in degrees north or south of the equator, which is 0°.
Each degree equals 1/360 of the distance around the world.
As you read in Chapter 2, the Sun heats Earth’s curved surface unevenly. Sunlight strikes Earth’s surface directly near the equator.
Near the poles, sunlight strikes the surface at a lower angle, so it is more spread out. In addition, the polar regions receive little or no solar energy during winter.
Because of this pattern of uneven heating, average annual temperatures generally decrease as you move closer to the poles. For example, Belém, Brazil, which is almost on the equator, has an average temperature of about 26°C (79°F). Qaanaaq, Greenland, located close to the North Pole, has an average temperature of only –11°C (12°F).
Latitude has the same effect on temperature in both hemispheres.
Suppose one city is located at 45° N and another city is located at
45° S. The first city is in the Northern Hemisphere, and the second is in the Southern Hemisphere. However, they are both nearly 5000 kilometers (3100 mi) from the equator, so they would receive about the same amount of sunlight over a year.
check your reading
What is the connection between latitude and temperature?
D 118 Unit: Earth’s Atmosphere
Page 3 of 7
Altitude
Altitude, the height above sea level, is another geographical factor that affects temperature. If you rode a cable car up a mountain, the temperature would decrease by about 6.5°C (11.7°F) for every kilometer you rose in altitude.
Why does it get colder as you move higher up? The troposphere is mainly warmed from below by
Earth’s surface. As convection lifts the warmed air to higher altitudes, the air expands and cools.
snow line tree line
Because altitude changes sharply on a mountain, different climates can exist within a small area.
Altitude increases can overcome the effect of lower latitudes on temperature. The temperature at the peak of a tall mountain is low regardless of the mountain’s latitude.
One example is Mount Stanley, near the border of Uganda and the Democratic Republic of the Congo in central Africa. Although it lies just a short distance from the equator, Mount Stanley has ice sheets and a permanent covering of snow. Notice in the illustration how one mountain can have several types of climates.
Even at the equator, a mountain peak can be covered with snow and ice.
Temperatures are too cold above this elevation for trees to grow.
SIMULATION
CLASSZONE.COM
Explore the effects of latitude and altitude.
How quickly do soil and water heat and cool?
PROCEDURE
1
2
3
Mark a line 3 centimeters from the top of each cup. Fill one cup to the line with water and the other with soil. Place a thermometer into the contents of each cup. Wait 2 minutes. Record the temperature in each cup.
Place the cups side by side in bright sunlight or under a lamp. Wait 10 minutes.
Record the temperature in each cup.
Move the cups into a shaded area to cool. Wait
10 minutes. Record the temperature in each cup.
WHAT DO YOU THINK?
• Which heats up faster, soil or water?
• Which cools faster?
• How might the heating and cooling rates of inland areas compare with those of coastal areas?
CHALLENGE Will adding gravel to the soil change your results? Repeat the activity to test your prediction.
SKILL FOCUS
Comparing
MATERIALS
• 2 cups
• ruler
• soil
• water at room temperature
• 2 thermometers
• sunlight or lamp
TIME
25 minutes
Chapter 4: Climate and Climate Change 119
Page 4 of 7
How Oceans Affect Climate
Regions near oceans have milder temperatures than inland regions at the same latitudes.
45
°
N
Portland:
Latitude: 45.6˚ N
Minneapolis:
Latitude: 44.9˚ N
35
°
N
PACIFIC
OCEAN
The bars in the graphs show average precipitation, and the lines show average temperature.
Compare each of these patterns in the two cities.
Portland (Marine Climate)
30˚ 30 cm
20
10
0
–10
–20
J F M A M J J A S O N D
Month
0
12
6
24
18
Minneapolis (Continental Climate)
30˚
20
10
30 cm
24
18
0
–10
12
6
–20
J F M A M J J A S O N D
Month
0
SOURCE: National Climatic Data Center
D 120 Unit: Earth’s Atmosphere
Large Bodies of Water
Land heats up and cools off faster than water. Because oceans and large lakes slow down heating and cooling of the air, coastal regions tend to have milder temperatures than areas far inland. Large bodies of water also affect precipitation. Climates influenced by these factors are called marine and continental climates.
• Marine climates occur near the ocean, usually along the west coasts of continents. Temperatures do not drop very far at night.
Summers and winters are mild. Many marine climates receive steady precipitation because winds blowing off the ocean bring moisture to the atmosphere. Large lakes can have a similar effect on the climates near their shores.
• Continental climates occur in the interior of continents.
Weather patterns vary in the different types of continental climates. However, most have large differences between daytime and nighttime temperatures because they lack the influence of nearby oceans. For the same reason, winter months are usually much colder than summer months.
check your reading
How are marine climates different from continental climates?
Page 5 of 7
Ocean Currents
Ocean currents are streams of water that flow through oceans in regular patterns. They influence climates by transferring energy from one part of an ocean to another. In general, warm-water currents carry warmth from the tropics to higher latitudes, where they help keep coastal regions warm. Cold-water currents have the opposite effect. They cool coastal regions by carrying cold water from polar regions toward the equator.
The illustration below shows the paths of ocean currents in the
North Atlantic. Find the Gulf Stream on the illustration. The Gulf
Stream is a major warm-water current. As the waters that feed the
Gulf Stream pass near the Caribbean Sea and the Gulf of Mexico, the concentrated solar rays that strike there warm its water. Water flowing in the Gulf Stream can be 6°C to 10°C (11–18°F) warmer than the surrounding water. The Gulf Stream warms the winds that blow over it. In turn, those winds warm coastal regions.
Like altitude, ocean currents can overcome the effects of latitude.
For example, London, England, has an average annual temperature of nearly 11°C (52°F). Natashquan, a town in eastern Canada at about the same latitude and altitude, has an average annual temperature of only 1°C (34°F). London’s milder climate is the result of an ocean current carrying warm water to Europe’s west coast.
VOCABULARY
A description wheel would be a good choice for taking notes about the term ocean current.
Ocean Currents
Ocean currents can cause two places at the same latitude to have different climates.
No rw a y
Arctic Circle
Natashquan, Canada
Average Temperature: 1ºC
Latitude: 50.2˚ N
L a br ado r
E
.
Gr ee n land
N.
At l a nti c
60
°
N
London, England
Average Temperature: 11ºC
Latitude: 51.5˚ N 40
°
N
Tropic of Cancer
Gulf of
Mexico
Gu l f S t r e a m
ATLANTIC
OCEAN
Caribbean Sea
N . E quator ial
Ca na ry
This map shows ocean currents that flow in the
North Atlantic.
Warm-water currents
Cold-water currents
20 ° N
Chapter 4: Climate and Climate Change 121
Page 6 of 7
MAIN IDEA AND DETAILS
Record in your notes the important details about seasonal changes.
Seasonal changes are part of climate.
What marks the change of seasons where you live? In the Midwest and New England, there are four distinct seasons. Mild spring and autumn months come between hotter summers and colder winters.
In Florida and other southern states, the seasonal changes are much less extreme.
Seasons are periods of the year associated with specific weather conditions, such as cold temperatures or frequent rain. These periods are part of the overall pattern that makes up a climate.
Temperature Patterns
Seasons occur because the amounts of energy that the Northern
Hemisphere and the Southern Hemisphere receive from the Sun change over the course of a year. Winter begins in the Northern
Hemisphere around December 21, when the daytime is shortest.
Summer begins around June 21, when the daytime is longest. Spring begins around March 21, and autumn begins around September 22.
On the first day of spring and of autumn, day and night are equal in length. There are 12 hours of daylight and 12 hours of darkness.
check your reading
Which seasons have the longest and the shortest periods of daytime?
Temperature patterns are an important feature of climate. The graph below shows the average monthly temperatures in Half Moon
Bay, California, and Bloomington, Indiana. Each city has an average annual temperature of about 12°C (54°F). However, Bloomington has hot summers and cold winters, while Half Moon Bay has mild weather all year. Although their average annual temperatures are the same, they have different climates.
Monthly Temperatures in Half Moon Bay, CA, and Bloomington, IN
25˚
20
15
10
5
0
–5
J F M A
Bloomington, IN
M J J
77˚
68
59
A S O N
Half Moon Bay, CA
D
23
50
41
32
Although the average annual temperature in each city is 12°C
(54°F), they have different monthly temperature patterns.
SOURCE: National Climatic Data Center
122 Unit: Earth’s Atmosphere
Dry Season Wet Season
Page 7 of 7
INDIA
These photos show the same rice fields in India at different times of the year.
Precipitation Patterns
Like temperature patterns, seasonal patterns of precipitation vary among different climates. For example, Connecticut’s precipitation is distributed fairly evenly throughout the year. In contrast, nearly half of Montana’s precipitation falls during May, June, and July. Many tropical regions have wet and dry seasons. These regions stay warm all year long, but certain months are much rainier than other months.
The seasonal pattern of precipitation can determine the types of plants that grow in a region and the length of the growing season.
Although Montana is a fairly dry state, much of its precipitation falls during the growing season. This pattern allows the state to be a major grain producer.
KEY CONCEPTS
1.
Explain the difference between climate and weather.
2.
Make a chart showing how latitude, altitude, large bodies of water, and ocean currents affect climate.
3.
How does the length of daytime change with each season?
CRITICAL THINKING
4. Predict How would a region’s climate change if a cold-water ocean current stopped flowing past it?
5. Identify Cause What geographical factors might cause a region to have a narrow temperature range and mild weather all year?
CHALLENGE
6. Infer Suggest specific climate characteristics that might make the owners of a vacation resort decide to advertise the average annual temperature rather than provide temperature averages for each month or season.
Chapter 4: Climate and Climate Change 123
