(Z score) given an area in either tail
advertisement
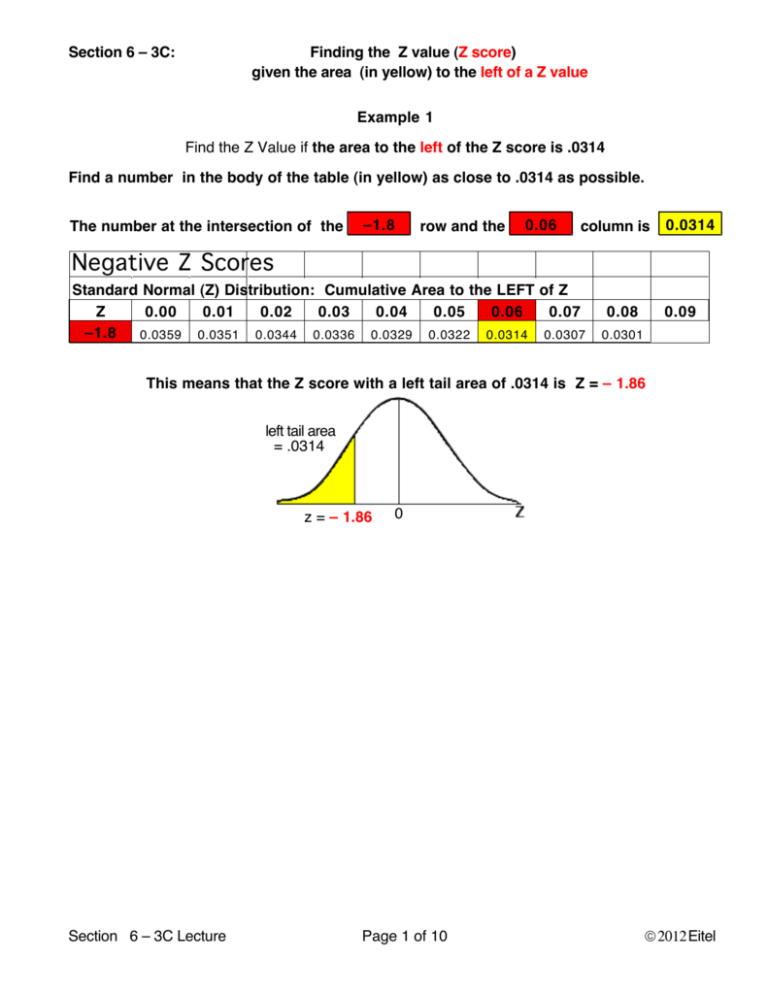
Section 6 – 3C: Finding the Z value (Z score) given the area (in yellow) to the left of a Z value Example 1 Find the Z Value if the area to the left of the Z score is .0314 Find a number in the body of the table (in yellow) as close to .0314 as possible. The number at the intersection of the –1.8 row and the 0.06 column is 0.0314 Negative Z Scores Standard Normal (Z) Distribution: Cumulative Area to the LEFT of Z Z 0.00 0.01 0.02 0.03 0.04 0.05 0.06 0.07 –1.8 0.0359 0.0351 0.0344 0.0336 0.0329 0.0322 0.0314 0.0307 0.08 0.09 0.0301 This means that the Z score with a left tail area of .0314 is Z = – 1.86 left tail area = .0314 z = – 1.86 Section 6 – 3C Lecture 0 Page 1 of 10 © 2012 Eitel Finding the Z value (Z score) given the area to the left of a Z value Example 2 Find the Z Value if the area to the left of the Z score is .1539 Find a number in the body of the table (in yellow) as close to .1539 as possible. The number at the intersection of the –1.0 row and the 0.02 column is 0.1539 Negative Z Scores Standard Normal (Z) Distribution: Cumulative Area to the LEFT of Z Z 0.00 0.01 0.02 0.03 0.04 0.05 0.06 0.07 –1.0 0.1587 0.1562 0.1539 0.1515 0.1492 0.1469 0.1446 0.1423 0.08 0.09 0.1401 0.1379 This means that the Z score with a left tail area of .1539 is Z = – 1.02 left tail area = .1539 z = – 1.02 Section 6 – 3C Lecture 0 Page 2 of 10 © 2012 Eitel Finding the Z value (Z score) given the area to the left of a Z value Example 3 Find the Z Value if the area to the left of the Z score is .01 Find a number in the body of the table (in yellow) as close to .01 as possible The number at the intersection of the –2.3 row and the 0.03 column is 0.0099 which is as close to .01 as possible Negative Z Scores Standard Normal (Z) Distribution: Cumulative Area to the LEFT of Z Z 0.00 0.01 0.02 0.03 0.04 0.05 0.06 0.07 –2.3 0.0107 0.0104 0.0102 0.0099 0.0096 0.0094 0.0091 0.0089 0.08 0.09 0.0087 0.0084 This means that the Z score with a left tail area of .01 is Z = – 2.33 left tail area = .01 z = – 2.33 Section 6 – 3C Lecture 0 Page 3 of 10 © 2012 Eitel Example 4 Find the Z Value if the area to the left of the Z score is .9845 Find a number in the body of the table as close to .9845 as possible (in yellow) The number at the intersection of the 2.1 row and the 0.06 column is 0.9846 which is as close to .9845 as possible Positive Z Scores Standard Normal (Z) Distribution: Cumulative Area to the LEFT of Z Z 0.00 0.01 0.02 0.03 0.04 0.05 0.06 0.07 2.1 0.9821 0.9826 0.9830 0.9834 0.9838 0.9842 0.9846 0.9850 0.08 0.09 0.9854 0.9857 This means that the Z score with a left tail area of .9845 is Z = 2.16 left tail area = .9846 z = 2.16 Section 6 – 3C Lecture Page 4 of 10 z © 2012 Eitel Finding the Z value (Z score) given the area to the right of a Z value Example 5 Find the Z Value if the area to the right of the Z score is .3520 The Z Tables only give areas to the left of a Z value. If we are given an area to the right then we must find the remaining area that is to the left of the Z value and then look that area up in the Z table. If the area to the right of the Z score is .3520 then the area to the left of the Z score is 1 – .3520 = .6480 Find a number in the body of the table as close to .6480 as possible (in yellow) The number at the intersection of the 0.3 row and the 0.08 column is 0.6480 Positive Z Scores Standard Normal (Z) Distribution: Cumulative Area to the LEFT of Z Z 0.00 0.01 0.02 0.03 0.04 0.05 0.06 0.07 0.3 0.6179 0.6217 0.6255 0.6293 0.6331 0.6368 0.6406 0.6443 0.08 0.09 0.6480 0.6517 This means that the Z score with a left tail area of .6480 and a right tail area of .3520 is Z = .38 left tail area = .6480 right tail area = .3520 z = .38 Section 6 – 3C Lecture Page 5 of 10 z © 2012 Eitel Finding the Z value (Z score) given the area to the right of a Z value Example 6 Find the Z Value if the area to the right of the Z score is .8185 The Z Table only gives areas to the left of a Z value. If we are given an area to the right then we must find the remaining area that is to the left of the Z value and then look that area up in the Z table. If the area to the right of the Z score is .8185 then the area to the left of the Z score is 1 – .8185 = .1815 Find a number in the body of the table as close to .1815 as possible (in yellow) The number at the intersection of the –0.9 row and the 0.01 column is 0.1814 which is as close to .1815 as possible Negative Z Scores Standard Normal (Z) Distribution: Cumulative Area to the LEFT of Z Z 0.00 0.01 0.02 0.03 0.04 0.05 0.06 0.07 –0.9 0.1841 0.1814 0.1788 0.1762 0.1736 0.1711 0.1685 0.1660 0.08 0.09 0.1635 0.1611 This means that the Z score with a left tail area of .1815 and a right tail area of .8185 is Z = –.91 left tail area right tail area = .1815 = .8185 z = –.91 Section 6 – 3C Lecture 0 Page 6 of 10 © 2012 Eitel Finding the Z value (Z score) given the area to the right of a Z value Example 7 Find the Z Value if the area to the right of the Z score is .9500 The Z Tables only give areas to the left of a Z value. If we are given an area to the right of a z value then we must find the remaining area that is to the left of the Z value and then look that area up in the Z table If the area to the right of the Z score is .9500 then the area to the left of the Z score is 1 – .9500 = .0500 Find a number in the body of the table as close to .05 as possible (in yellow) The body of the table has a 0.0505 and a 0.0495 which are equally close to .0500 but The cells at the bottom of the table says for an area of 0.0500 use Z = –1.645 Negative Z Scores Standard Normal (Z) Distribution: Cumulative Area to the LEFT of Z Z 0.00 0.01 0.02 0.03 0.04 0.05 0.06 0.07 –1.6 0.0548 0.0537 0.0526 0.0516 0.0505 0.0495 0.0485 0.0475 Z scores of –3.5 or less use .0001 AREA Z Score 0.0500 –1.645 AREA 0.08 0.09 0.0465 0.0455 Z Score 0.0050 –2.575 This means that the Z score with a left tail area of .0500 and a right tail area of .9500 is Z = –1.645 left tail area = .0500 right tail area = .9500 z = –1.645 Section 6 – 3C Lecture Page 7 of 10 © 2012 Eitel Example 8 Find the Z score that separates the bottom 60% of the Z Distribution from the upper 40% of the Z Distribution The Z score that separates the bottom 60% of the Z distribution from the upper 40% of the Z distribution is the Z score that has an area to the left of the Z score of 60% or .60 Find the Z Value if the area to the left of the Z score is .60 Find a number in the body of the table as close to .60 as possible (in yellow) The area to the left of z = .25 is .5987 which is as close to .60 as possible This means that the Z score with a left tail area of .60 is Z = .25 Positive Z Scores Standard Normal (Z) Distribution: Cumulative Area to the LEFT of Z Z 0.00 0.01 0.02 0.03 0.04 0.05 0.06 0.07 0.2 0.5793 0.5832 0.5871 0.5910 0.5948 0.5987 0.6026 0.6064 0.08 0.09 0.6103 0.6141 left tail area = .5987 z = .25 z The Z score with a left tail area as close as possible to .60 is Z = .25 The Z score that separates the bottom 60% of the Z Distribution from the upper 40% of the Z Distribution is .25 The number that has 60% of the data below it is called The 60th percentile or P60 so The 60th percentile or P60 = .25 Section 6 – 3C Lecture Page 8 of 10 © 2012 Eitel Example 9 Finding the 10th percentile or P10 for a Z distribution The 10th percentile for a Z distribution is the Z score that separates the bottom 10% of the Z distribution from the upper 90% of the Z distribution. Find a Z score that has .10 in the left tail Find the Z Value if the area to the left of the Z score is .10 Find a number in the body of the table as close to .10 as possible (in yellow) The area to the left of z = –1.28 is .1003 which is as close to .10 as possible This means that the Z score with a left tail area of .10 is Z = –1.28 Negative Z Scores Standard Normal (Z) Distribution: Cumulative Area to the LEFT of Z Z 0.00 0.01 0.02 0.03 0.04 0.05 0.06 0.07 –1.2 0.1151 0.1131 0.1112 0.1093 0.1075 0.1056 0.1038 0.1020 0.08 0.09 0.1003 0.0985 left tail area = .1003 z = – 1.28 0 The Z score with a left tail area as close as possible to .10 is Z = –1.28 The 10th percentile or P10 for a Z distribution is –1.28 Section 6 – 3C Lecture Page 9 of 10 © 2012 Eitel Example 10 Finding the 80th percentile or P80 for a Z distribution The 80th percentile for a Z distribution is the Z score that separates the bottom 80% of the Z distribution from the upper 20% of the Z distribution. Find a Z score that has .80 in the left tail Find the Z Value if the area to the left of the Z score is .80 Find an number in the body of the table as close to .80 as possible (in yellow) The area to the left of z = .84 is .7995 which is as close to .80 as possible This means that the Z score with a left tail area of .80 is Z = .84 Negative Z Scores Standard Normal (Z) Distribution: Cumulative Area to the LEFT of Z Z 0.00 0.01 0.02 0.03 0.04 0.05 0.06 0.07 0.8 0.7881 0.7910 0.7939 0.7967 0.7995 0.8023 0.8051 0.8078 left tail area = .80 0.08 0.09 0.8106 0.8133 right tail area = .20 0 z = .84 z The Z score with a left tail area as close as possible to .80 is Z = .84 The 80th percentile or P80 for a Z distribution is .84 Section 6 – 3C Lecture Page 10 of 10 © 2012 Eitel
