Rock Properties and Seismic Response of Chert Reservoirs, the
advertisement
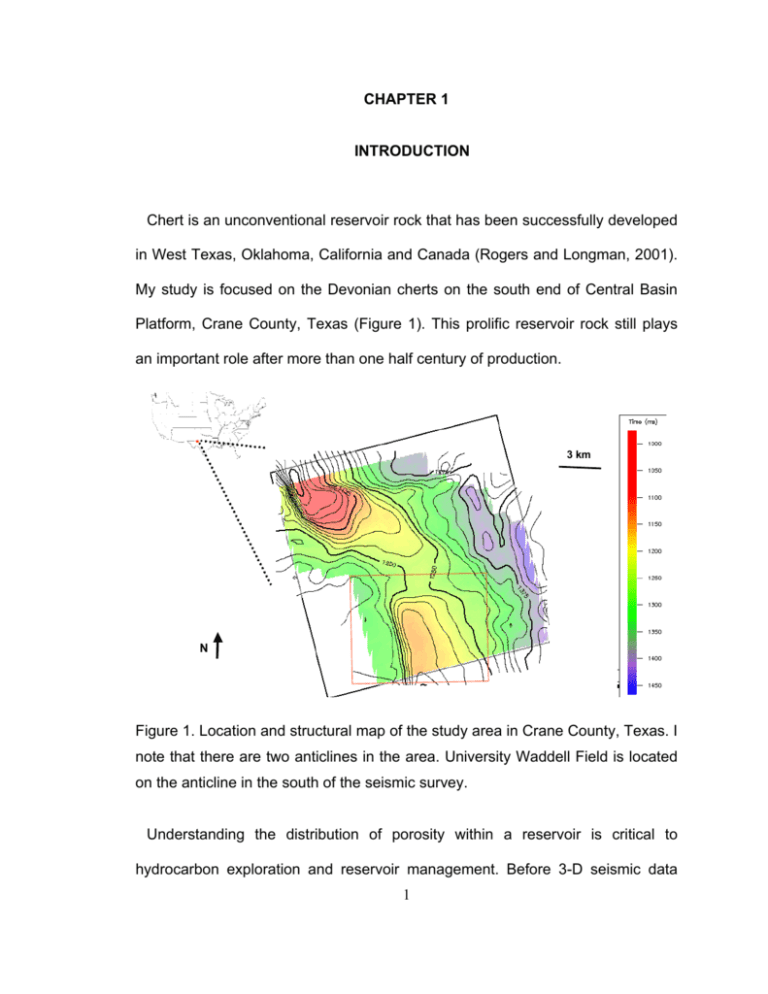
CHAPTER 1 INTRODUCTION Chert is an unconventional reservoir rock that has been successfully developed in West Texas, Oklahoma, California and Canada (Rogers and Longman, 2001). My study is focused on the Devonian cherts on the south end of Central Basin Platform, Crane County, Texas (Figure 1). This prolific reservoir rock still plays an important role after more than one half century of production. 3 km N Figure 1. Location and structural map of the study area in Crane County, Texas. I note that there are two anticlines in the area. University Waddell Field is located on the anticline in the south of the seismic survey. Understanding the distribution of porosity within a reservoir is critical to hydrocarbon exploration and reservoir management. Before 3-D seismic data 1 were acquired, cores and well logs were used to correlate and interpolate the porosity distribution between wells and to extrapolate the distribution beyond the area covered with well control. This method works well if the structure and stratigraphy are simple and if the wells are evenly populated over the area of interest. However, in many cases, there are an insufficient number of wells to sample complicated, compartmentalized reservoirs. There are well logs from about 150 wells available in the University Waddell Field (Figure 2) and the most common log types include Gamma Ray, Neutron and Sonic (Figure 4). A’ W A 1 km Figure 2. Structural map of University Waddell Field in Crane County, Texas, defined by the square in Figure 1. Black solid circles are producing wells and filled bubbles represent cumulative production in the first 12 months. Other well symbols indicate non-producing wells. Cross section AA’ through well “W” will be displayed in Figure 3. 2 A 1 km W A’ Thirtyone BEG-C Frame Figure 3. Cross section through the well “W” indicated in Figure 2 by the arbitrary line A-A’. The cross section delineates the anticline with a near north-south axis. Thirtyone Formation is marked between horizons Thirtyone and Frame. BEG-C represents the top of the primary porous chert interval. Production data of the producing wells as well as over 1000 feet cores in the field are also available to my study. In addition to well data, I have access to a 14 by 15 kilometer 3-D seismic data volume (Figure 1), which allows us to map structure and stratigraphy (Figures 2 & 3) and to generate various seismic attributes. While seismic attributes can provide us with statistical estimates of reservoir properties, Kalkomey (1997) warns that interpreters must be wary of false positive correlations. I followed her advice and therefore generated a suite of 3 Thirtyone Gamma Porosity Density Vp Impedance Laminated Chert Thick-bedded Chert Laminated chert BEG-A BEG-B BEG-C Carbonates Laminated Chert Thick-bedded Chert Laminated Chert Figure 4. Type well (“W” in Figures 2 & 3) logs from the University Waddell Field, Crane County, Texas. I note that the Thick-bedded Chert is porous and has distinguishable log response. There are two porous chert intervals; the lower one that is below BEG-C marker is more consistent throughout the field. seismic attribute cubes that have a well-established sensitivity to reservoir properties of interest: acoustic impedance to porosity, coherence to faults (Marfurt et al., 1998), curvature to fractures (Roberts, 2001), and coherent energy gradients to lateral changes in tuning thickness (Marfurt, personal communication). With the data above, I attempt to define a detailed distribution of the porous chert and fluid content. I also attempt to characterize fractures in the chert reservoirs. The integration of results from these efforts provides us with 4 invaluable information for seismic, log and core calibration and for reservoir characterization of chert reservoirs in the Permian Basin. 5 CHAPTER 2 METHODS I used core measurements, electric logs, and 3-D seismic data in this study. Core measurements provide us with the most detailed, robust estimates of reservoir properties. Electric logs from more than 300 wells provide continuous but discrete measures of Gamma Ray, Resistivity and Sonic at vertical resolution up to 1 m. Seismic data provide vertical resolution of only 25 m or so but sample the 3-D reservoir continuously with 35 m by 35 m (110 ft by 110 ft) bins, allowing us to integrate the more detailed log and core measurement within their appropriate depositional and structural deformation framework. Although Kallweit and Wood (1982) show that seismic data can only resolve features greater than ¼ wavelength, they recognize that my ability to detect lateral changes in thickness can go significantly finer. 3-D seismic attributes allow us to extract such subtle, sub-seismic features on time slices and maps, thereby allowing the interpreter to delineate structural and stratigraphic features of interest and link them through depositional and deformation models to the sparse well control. I collected 28 core samples from three cored wells spanning the suite of lithofacies defined by Ruppel and Hovorka (1995), as well as by Ruppel and Barnaby (2001). After core descriptions (Appendix A), I measured bulk density and porosity of all 28 samples, which had been dried in the oven. I then selected 11 of the dry samples representing tight and porous facies and measured P- and S6 wave velocities under differential pressures varying from 1000 Psi (6.8 MPa) to 5000 Psi (34 MPa). I used the methods of Batzle and Wang (1992) to calculate fluid properties at various temperatures and pressures. Next, I used Gassmann’s (1951) fluid substitution method to calculate the rock properties at the simulated reservoir conditions. Finally, I calculated the properties measured by the seismic experiment: density, P- and S- wave velocities, and impedance. I interpreted the seismic data, using well logs for control. The use of synthetic seismograms as well “W” (Figure 3) indicates the validity of the seismic-well tie. I picked Devonian Thirtyone and Frame, which are the top and bottom of Thirtyone Formation, as well as BEG-C marker which is the top of the main porous chert reservoir (Ruppel and Barnaby, 2001), throughout the whole seismic survey. The two Formation tops were not difficult to pick but picking BEG-C marker was a tedious task. Acoustic impedance, which is the product of P-wave velocity and density, is the seismic rock property most successfully linked to porosity (Russell, 1988). The impedance contrasts between layers determine the reflectivity of seismic waves. Latimer et al. (2000) used a wedge model to indicate that an impedance inversion significantly increases resolution and decrease errors in the thickness estimation due to side lobes. I therefore built an impedance model with nine wells with sonic logs and then ran a seismic inversion. The initial model provides broader frequency content than the band-limited seismic data and compensates 7 the seismic data with low frequency information (Russell and Lindseth, 1982; Russell, 1988). Then based on the relationship I found in the lab, I interpreted the inverted impedance data for lithology, porosity and fluid distribution. Fractures are of great importance in the micro-pore chert reservoirs due to their enhancement on permeability. Fractures can increase the porosity by 1-2 percentages, but seismically more important, they reduce the strength of the rock, which can be represented by Bulk and Shear Moduli such that seismic velocity decreases when a wave propagates across fractures. We attempted to measure the effect of fractures on velocities in the lab but the results were not convincing. First, I noted that the signal in the core sample could be distorted after the wave travels through the fractures, making it difficult to pick. Since none of my fractures were through-going (if so, I would have a broken sample), Fermat’s Principle dictates that a wave will travel along a path that results in the shortest time, such that energy bends around the slower fractured zones. In summary, for the same core sample, the first arrival time through the fractured part of the sample was indistinguishable from the first arrival time through the unfractured part of the rock. Although I cannot measure the impact on velocities at the core scale, I can still measure the degree to which the fracture is sampled. Fractures are well known to affect wave propagation at the seismic scale, and may be measured in terms of travel-time thickness, incoherent scattering, and anisotropy. 8 Although I am unable to calibrate the effect of fractures on velocity on cores, I can still strive to establish a statistical relationship between seismic attributes and my core measurements of fracture density. I used three families of geometric attributes: 1) well-established coherence measures, 2) more recently developed attributes of spectrally limited estimates of volumetric curvature, and 3) coherent energy gradients. Estimation of coherence illuminates lateral changes in waveforms and is an excellent indicator of faults and channels. Coherent energy gradients allow us to measure effects related to more subtle lateral changes in thickness, lithology, fluid, and porosity. Reflector dip, azimuth, curvature, and rotation are all measures of the reflector shape. Curvature has a well-established statistical relationship to fractures (e.g. Lisle, 1994; Hart et al., 2002). These families of attributes are mathematically independent, but are coupled to each other through the underlying geology (Marfurt, 2005). The attribute technology I use produces full 3-D volumes that are calculated from seismic traces directly, without requiring pre-interpreted horizons. This technology precludes unintentional bias and picking errors introduced during the interpretation process (Blumentritt, et al., 2005). 9 CHAPTER 3 RESULTS 3.1 Laboratory Measurements and Fluid Substitution I measured rock properties of 4 different lithofacies defined by Ruppel and Barnaby (2001): limestone, thick-bedded chert, laminated chert, and brecciated chert. Then, I calculated the rock properties with various fluid contents using the fluid substitution method introduced in Chapter 2 and the detailed results are listed in Appendix B. The results indicate that lithology is the most important control of the elastic properties (Figures 5 & 6). Limestone not only has a high grain density (2.71 g/cc) but also displays the highest velocities among all lithofacies present in the Thirtyone Formation. Among the chert lithofacies, the thin-laminated chert and mixed chert-carbonate lithofacies have lowest porosities and highest velocities. Thick-bedded chert and massive chert lithofacies are more porous, with porosities higher than 10%. Laminated cherts and carbonates have less than 5% porosity, and limestone averages about 2% porosity. I found that porosity has a very strong relationship to velocity. Both P- and Swave velocities in porous chert lithofacies are much slower than in those lessporous limestone and thin-laminated cherts (Figure 7 & 8). 10 P-wave Velocity (km/s) 7.00 6.00 5.00 4.00 3.00 CB-S CB-S CB-P CB-S CB-S CB-BB CB-S C-B CL-D CL-S LM Samples Figure 5. P-wave velocity vs. lithofacies. The left cluster is dominantly thickbedded chert; the middle cluster is chert/carbonates laminae; and the right is a limestone sample. Poro sity 30.0% Thick-bedded chert 25.0% 20.0% 15.0% 10.0% Laminated chert/carbonates 5.0% 0.0% Sample Figure 6. Porosity vs. lithofacies. I note that porosity is a good indicator of lithofacies. The dotted line separates the laminated chert and limestone (on the left) from the more porous thick-bedded chert. 11 6.00 5.50 Vp (km/s) 5.00 4.50 4.00 3.50 3.00 0% 5% 10% 15% 20% 25% 30% Porosity Vpd Vpw Vpo Vp_ss(w) Figure 7. P-wave velocity vs. porosity showing a linear relationship. Vpd, Vpo, and Vpw are P-wave velocities of dry, oil-saturated and water-saturated chert respectively. I plot P-wave empirical curve for water-saturated sandstone, Vp_ss (w) (Han et al., 1986) for comparison. Relationships: Vpw = -8.058φ + 5.9408, R2 = 0.9651; Vpo = -8.1564φ + 5.8723, R2 = 0.967; dry: Vpd= -7.6015φ + 5.8388, R2 = 0.9578; Vp_ss (w)= -7φ + 5.6, R2 = 1. Fluid substitution results (Figure 7 & 8) indicate that fluid plays a less important role than lithology or porosity. My measurements also indicate that water saturated chert behaves similarly to the published data for consolidated sandstones under water saturation (Han et al., 1986). However, my chert velocity is always higher than sandstone at a given porosity. The difference between chert and sandstone velocities becomes larger when the porosity is lower, resulting from the fact that the rock frame of chert is stiffer than that of 12 sandstone. The Vp/Vs ratio is more sensitive to fluid variation. Water- saturated rock has a higher Vp/Vs ratio than oil saturated or dry rock; dry rock has the lowest Vp/Vs ratio (Figure 9). 4.00 V s ( k m /s ) 3.50 3.00 2.50 2.00 0% 5% 10% 15% 20% 25% 30% Porosity Vsd Vsw Vso Vs_ss(w) Figure 8. S-wave Velocity vs. Porosity showing a linear relationship. Vsd, Vso, and Vsw are S-wave velocities of dry, oil-saturated and water-saturated chert respectively. Vs_ss (w) is the empirical S-wave curve for water-saturated sandstone (Han et al., 1986). Dry Vsd = -5.2041φ + 3.7331, R2 = 0.9263; Vso = 5.55φ + 3.7276, R2 = 0.9369; Vsw = -5.769φ + 3.7224, R2 = 0.9428. Vs_ss (w) = -4.91φ + 3.52, R2 = 1. 13 4.00 V s (k m /s ) 3.50 3.00 2.50 2.00 3.00 . 3.50 4.00 4.50 5.00 5.50 6.00 Vp (km/s) Vsd Vsw Vso Vs_ss(w) Figure 9. S- vs. P-wave velocity. The Vp/Vs ratio varies with different fluid saturation. Notations are the same as Figures 7 and 8. Vpd = 0.6927Vsd 0.3019, R2 = 0.99; Vpo = 0.6881Vso - 0.3037, R2 = 0.9908; Vpw = 0.7204Vsw 0.552, R2 = 0.9893; Vp_ss (w) = 0.7014Vs_ss (w) - 0.408 (Han et al., 1986). I also calculated impedance values based on the core measurements and fluid substitution. Both P-wave and S-wave impedance indicate a direct relationship with porosity (Figures 10 & 11). I also note that the impedance values in different lithofacies vary tremendously and that thick-bedded chert has much lower impedance than laminated chert and limestone (Figure 12). 14 Im p e d a n c e (g *k m /c c *s ) 17.00 15.00 13.00 11.00 9.00 7.00 5.00 0% 10% 20% 30% Porosity Zpd Zpw Zpo Figure 10. P-wave (acoustic) impedance vs. porosity. The linear curves mean that I can use impedance to invert for porosity or use porosity to predict impedance. Zpd, Zpw and Zpo are P-wave impedance of dry, water-saturated and oil-saturated chert respectively. Zpd = -28.86φ + 14.94; R2 = 0.9838: Zpw = 26.226φ + 15.327; R2 = 0.9782; Zpo = -27.851φ + 15.088, R2 = 0.9826. 15 Im p ed an ce (g *km /cc*s) 10.00 9.50 9.00 8.50 8.00 7.50 7.00 6.50 6.00 5.50 5.00 0% 10% 20% 30% Porosity Zsd Zsw Zso Figure 11. S-wave impedance vs. porosity. Zsd, Zsw and Zso are S-wave impedance of dry, water-saturated and oil-saturated chert respectively. Regression results: Zsd = -19.12φ + 9.5428, R2 = 0.9676; Zso = -18.445φ + 9.5672, R2 = 0.9644; Zsw = -17.984φ + 9.5853, R2 = 0.9619. 16 20.00 P-wave Impedance (km*g/s*cc) 18.00 16.00 14.00 12.00 10.00 8.00 6.00 4.00 CB-S CB-S CB-S CB-P CB-S CB-S CB-BB CB-S C-B CL-D LM Sample Dry sample Water satuated Figure 12. P-wave impedance vs. Lithology. CB, CL, LM represents thick-bedded chert, laminated chert, and limestone. I note that thick-bedded chert has much lower impedance than laminated chert and limestone. 3.2 Acoustic Impedance Inversion I inverted the seismic data to generate a 3-D acoustic impedance volume. The impedance volume illuminates the distribution of porosity and lithology both aerially and vertically (Figures 13 & 14). I plotted cumulative production data of first 12 months to correlate to impedance. I note all the producing wells fall in the area where the impedances are low, i.e. porosities are high based on the correlation I developed in the core measurements, fluid substitution and log data. However, the production rates vary within the low-impedance area and the 17 presence of variation reflects heterogeneity that might result from other factors such as fractures. High AI Low φ 3 km Impedance Borehole Production (bbl) (km/s*g/cc) 15.5 1600-26000 26000-50800 15.0 50800-75300 75300-99900 99900-12500 14.5 14.0 12500-14900 13.5 13.0 A’ N A Low AI High φ 12.5 12.0 Figure 13. The average impedance beneath the BEG-C, a marker of the lower pay interval of chert reservoirs. The contours are time structure of BEG-C. It illuminates the distribution of low impedance/high porosity in the survey. It is also an indicator of different lithofacies. I note some artifacts exist along some heavily faulted area. Cross section AA’ is shown in Figure 14. 18 A 1 km W A’ Impedance (km/s*g/cc) 16.5 15.5 14.5 Woodford Shale 13.0 Thirtyone 12.0 BEG-C 10.5 Frame 9.5 8.5 Figure 14. A cross-section AA’ (Figures 2 & 13) through a seismic acoustic impedance volume. It shows that a low impedance layer below BEG-C maker and the background in Thirtyone Formation are carbonate rock, dominantly limestone. 3.3 Seismic Attributes Reflector curvature, coherence and coherent gradient volumes highlight subtle lineaments that are not seen or are hard to detect in conventional seismic sections and time slices. Among various attributes, I note curvature provides more geologically intriguing information than other attributes. I therefore ran a statistical analysis of the orientation of the lineaments observed in time slices through the chert reservoir interval, and created a rose diagram for structural analysis (Figure 15). I note there is a conjugate set of fractures in NWW-SEE and 19 NNE-SSW. I also note there are at least two big high-angle reverse faults on both the east and west sides of the anticline. I also found the presence of a high angle reverse fault to the north of the University Waddell Field. I suspect that at least two stages of faulting occurred in the area to produce such a scenario. The favorable paths of water flooding in this area are in the direction of NE-SW. If this orientation is that of the tension fractures, a left-lateral coupling stress regime can be proposed based on Sylvester’s (1988) Simple Shear Model. Lineaments Rose Diagram Borehole Production (bbl) 1600-26000 26000-50800 50800-75300 75300-99900 99900-12500 1km N 12500-14900 Figure 15. Curvature map created from conventional seismic data. I picked lineaments that are displayed in the rose diagram showing their variation with azimuth. The bubbles represent the first 12-month cumulative production. 20 CHAPTER 4 DISCUSSION AND CONCLUSION Since I am using data sets acquired at various scales (e.g. velocity data), I am careful about the scaling issue. My results from laboratory measurements and calculation using Gassmann’s (1951) equation show good correlation to log data (Figure 16). This fact validates log data on which a geological model is built using Impedance (km/s*g/cc) Sonic logs for seismic impedance inversion. 18 17 16 15 14 13 12 11 10 9 8 Log data Core data 0 0.05 0.1 0.15 Porosity (fraction) 0.2 phi>0.1 phi<=0.1 0.25 Figure 16. Porosity vs. Impedance from both core and log data. All dots are from well log data. Blue dots are samples with porosity lower than 10% while red dots are samples with porosity higher or equal to 10%. Blue line is derived from core data in water-saturated case, to compare with the log data. 21 From the results of my lab work, I found that reservoir quality chert could be separated from carbonate rocks by its low density (high porosity) and low velocity, which results in a more significant low impedance. My results show that acoustic impedance does a great job in delineating the primary lithofacies due to clear contrasts between the porous chert and tight laminated chert and limestone. However, results from fluid substitution using Gassmann’s (1951) equation indicate that oil and water in chert have very close impedance values and it is difficult to differentiate the fluids in chert due to the stiff rock frame. I thus can neglect the difference between oil and water to derive porosity from impedance value with the relationship developed in the core measurements and fluid substitution. Acoustic impedance then provides a direct measurement of porosity. My seismic impedance volume delineates the distribution of porous lithofacies. I also note it is a viable way to classify various rock types based on their impedance values. We are able to apply this technique in the Central Basin Platform because of the apparent contrast among different chert lithofacies and between chert and other carbonate rocks. Seismic impedance illuminates the boundaries between different strata and provides a lot more geologic information than the conventional seismic data. However, it will be altered when the reservoir thickness falls below ¼ wavelength (Russell, 1988). 22 My attempt to measure the effect of fractures on velocity through core measurements failed. While this failure precludes a quantitative estimate of fracture density from seismic velocity measurements, I may still use the fracture counts as calibration for a statistical estimation of fractures. Seismic attributes work best in predicting reservoir properties when there is a strong correlation between the attribute of interest and underlying rock physics, depositional environment, or structural deformation. Rock physical analysis can work as a bridge to link cores, well logs and seismic data by understanding the basics of the rock properties. In my thesis I share some of my initial work in calibrating the use of such attributes to an unconventional, but important reservoir rock – the Thirtyone chert of the Central Basin Platform, Texas. Through laboratory core measurements, I have established a simple, highly accurate, linear relationship between porosity and both P-wave velocity and P-wave impedance. I therefore expect attributes sensitive to changes in travel time thickness, such as spectral decomposition and coherent energy gradients, to measure porosity-driven changes in P-wave velocity. Preliminary analysis shows a qualitative correlation between reflector curvature and initial production. This agrees with observations made by Hart et al. (2002) in a fractured carbonate reservoir. However, fractures are not always contributive to 23 hydrocarbon production. I note that high production wells are frequently present in areas with fewer pronounced fracture lineaments or are in areas of low negative curvature values or high positive curvature values. My observation on the cores from the University Waddell Field also shows that thick-bedded chert is less fractured than laminated chert and limestone. At the field scale, pronounced fractures may be connected to the free water below the oil-water contact. Fractures in this study area might penetrate the underlying water reservoir. This speculation explains why all the producing wells are on the crest and west ridge of the anticline where the fractures are smaller; in contrast, water wells are present on the east ridge of the anticline where the fracture lineaments are more pronounced. 24 APPENDIX A CORE DESCRIPTION I observed over 1000 ft core 3 wells, Wells 161, 162 of University Waddell Field and Arco-K4 of Block 31 Field. Well 161 of University Waddell is the best candidate in terms of its completeness and integrity of the core. I use this well as an example to demonstrate the lithofacies and structural features present in my study area. The cores are displayed in boxes that are 90cm long. Depth increases from top down and from left to right (portrait view). 25 26 chert appear to have higher teeth than other lithofacies. stylolites have been dissolved on surface by unknown reasons (might be in-situ condition). Stylolites in brecciate veins or stylolites in all directions and dips. Some are brecciaed, not porous as thick-bedded chert. Some veins and Box 1: 8471-77, 78-83, 84-90 ft in depth. 9/19 ft core recovered. Laminated chert/carbonates. Large amount of 27 laminated chert/carbonate. Box 2: 8490-97, 8498-8504, 8405-09 ft. 6 ft /20 ft core is recovered. Thick-bedded chert dominates. Contains some 28 color, brecciated chert. vertical fracture, dipping 80 degree, at 8516ft, partially filled with calcite. 8522-8532: 4/11 ft recovered, light Box 3: 8510-16, 17-24, 25-32 ft. 9/23 ft core is recovered. 8510-8521: 5/12ft recovered, thick-bedded chert. 1 29 chert, fewer stylolites, less porous. cemented with carbonate mud. Stylolites are present with 0.5cm high teeth. Lower part (8549-8556): less-brecciaed Box 4: 8533-40, 8541-47, 8548-56 ft. 9/24 ft core is recovered. 8533-8548: 7/16 ft core recovered. Brecciate, porous, 30 developed. Induced fractures developed along stylolites. Stylolites teeth are 0.5-1.5 cm high. Lower part is carbonate. Box 5: 8557-64, 8565-73, 8574-81 ft. 9/25 ft core recovered. Brecciaed chert and carbonates laminae. Stylolites 31 Box 6: 8582-89, 8590-99, 8600-09 ft. 9/28 ft core recovered. Dark. Laminated chert and carbonates (limestone). 32 Chert is brecciated near stylolites. Box 7: 8610-16, 8617-60, 8661-97 ft. 9/188 ft core recovered. Same as Box 6. Dark laminated chert and carbonates. 33 includes thick-bedded chert and laminated chert. Box 8: 8798-8805, 8806-16, 8817-25 ft. 9/48 ft core recovered. Light color chert and limestone mixture. Chert 34 Horizontal bedding. Box 9: 8826-34, 8835-45, 8846-54 ft. 9/28 ft core recovered. Limestone dominates. Some laminated chert is present. 35 part is light-gray limestone. Box 10: 8855-62, 8863-74, 8875-84 ft. 9/30 ft core recovered. 8855-62 ft, limestone/chert mixture is present. Lower 36 chert and contains more stylolites. Box 11: 8885-93, 8894-8903, 8904-14 ft. 9/30 ft core recovered. 5 ft Carbonates at the top. Lower part is laminated or small fault. The stylolites are weak points. Many core breaks at stylolites. Laminated chert is present. Clusters of calcite are present at the chert boundaries. One stylolite dips at 60 degree. It might be a sealed fracture Box 12: 8915-25, 8926-36, 8937-45 ft. 9/30 ft core recovered. Thick-bedded chert is present with fewer stylolites. 37 38 Chert nodules present. Stylolites are present with teeth 1-3 mm high. Box 13: 8946-55, 8956-65, 8966-75 ft. 9/29 ft core recovered. Laminated chert dominates. Bioclasts are present. 39 mixed. Stylolites developed with 0.5 cm high teeth. Carbonates nodules present. Box 14: 8976-84, 8985-93, 8994-9003 ft. 9/27 ft core recovered. Light gray, laminated chert and thick-bedded chert 40 lower interval. present in dark color. Vertical veins developed at 2-3 cm spacing. Stylolites development is less intense than the Box 15: 9004-10, 9011-17, 9018-25 ft. 9/19 ft core recovered. Laminated chert dominates. Some carbonates are 41 These veins might be open in the subsurface. pay interval. The rock is very permeable. Vertical veins are seen in the chert, spacing at 2-3 cm. filled with calcite. Box 16: 9026-35, 9036-46, 9047-55 ft. 9 of 29 ft core is recovered. Thick-bedded chert dominates. This is in the main 42 stylolites. Veins are normally filled with calcite, which were originated from dissolution from stylolites. present. Stylolites are common with a centimeters spacing. Veins are developed between stylolites and stop at Box 17: 9056-9071, 9080-88, 9090-98 ft. 9 out of 42 ft recovered. Laminated chert and thick-bedded chert are 43 underground. absorption efficiency of water spray. Oil stains are seen along the stylolites, which might be conduit of fluid bedded chert is present. The light-color laminated chert is more permeable than dark ones, indicated by the Box 18: 9099-9107, 9008-15, 9016-23 ft. 9/24 ft recovered. Laminated chert/carbonates dominate. Some thick- 44 Stylolites are well developed with spacing at 5mm, teeth height less than 1mm. This might affect the wave velocity. Box 19: 9124-31, 9132-39, 9110-48 ft. 9/24 ft recovered. Light to dark laminated chert/carbonates deposited. 45 Vertical veins developed in the beddings and end at stylolites. Box 20: 9149-58, 9159-69, 9170-75. 7/ 26 ft recovered. Dark and glassy chert is brittle and broken into pieces. 46 beddings and stop at boundaries. Box 21: 9176-9185, 9186-9183 ft. Dark, glassy chert, brittle, broken into pieces. Vertical veins developed in the APPENDIX B RESULTS OF LABORATORY MEASUREMENTS AND FLUID SUBSTITUTION I measured 28 dry 1-inch core plugs for porosity. Then I selected 11 samples and measured their P-and S-wave velocities. Next, I used Gassmann’s (1951) equation to calculate their velocities in in-situ pressure and temperatures given different fluid types, oil and water. The Gassmann’s (1951) equation I used for fluid substitution can be written as: 4 3 φ 1 − φ − K dry / K ma + , where K ma K fl ρV p 2 = K dry + µ dry + (1 − K dry / K ma ) 2 / • Ksat Total Bulk modulus • Kma Bulk modulus of the matrix, use V-R-H average (Hilterman, 2001) • Kdry Bulk modulus of the porous rock frame, use core measurements • Kfl Bulk modulus of the fluid, calculated with method developed by Batzle & Wang (1992) • µdry Shear Modulus, = ρVs2 • Vp P wave velocity, =[(K+4/3µ)/ρ]1/2 • Vs Shear Wave Velocity, use core measurements • Φ Porosity, use core measurements I present the results in the following tables. 47 Table 1. Porosity measurements. L, Vb, Vg, Db and Dg represent sample length, bulk volume, grain volume, bulk density and grain density respectively. Well No. Sample L(cm) W(gm) Vb Vg Db Dg Porosity 161 161 161 161 161 161 161 161 162 162 162 162 162 162 162 162 162 162 162 162 162 Arco-K4 Arco-K4 Arco-K4 Arco-K4 Arco-K4 Arco-K4 Arco-K4 1 2 3 4 5 6 7 8 1 2 3 4 5 6 7 8 9 10 11 12 13 1 2 3 4 5 6 7 3.078 3.485 2.850 3.470 3.350 2.580 2.480 2.065 3.340 2.800 3.500 2.740 3.090 3.300 3.517 3.320 3.090 3.024 3.380 3.260 2.751 3.365 3.000 2.310 3.065 3.310 2.510 3.450 38.03 35.65 35.14 46.4 37.09 24.65 32 26.65 36.41 28.32 41.06 36.18 41.43 38.69 36.38 37.08 39.97 35.36 37.61 42.06 35.72 44.81 30.52 29.92 40.23 34.15 25.25 39.68 15.43 17.38 14.26 17.43 16.71 12.87 12.38 10.32 16.72 14.04 17.53 13.72 15.53 16.52 17.69 16.62 15.47 15.17 16.93 16.31 13.78 16.74 14.96 11.51 15.29 16.57 12.52 17.19 14.92 13.54 13.41 17.17 14.07 9.29 12.21 10.20 13.80 10.78 15.55 13.40 15.30 14.61 13.88 14.06 15.30 13.43 14.39 16.21 13.66 16.54 11.62 11.11 14.90 13.02 9.62 14.99 2.47 2.05 2.46 2.66 2.22 1.92 2.59 2.58 2.18 2.02 2.34 2.64 2.67 2.34 2.06 2.23 2.58 2.33 2.22 2.58 2.59 2.68 2.04 2.60 2.63 2.06 2.02 2.31 2.54 2.64 2.62 2.70 2.64 2.65 2.62 2.61 2.64 2.63 2.64 2.70 2.71 2.65 2.62 2.64 2.61 2.63 2.61 2.59 2.62 2.71 2.63 2.69 2.70 2.62 2.62 2.64 2.8% 22.2% 5.9% 1.5% 15.8% 27.8% 1.4% 1.3% 17.5% 23.3% 11.2% 2.3% 1.5% 11.5% 21.6% 15.4% 1.1% 11.4% 15.0% 0.60% 0.8% 1.2% 22.3% 3.5% 2.6% 21.5% 23.2% 12.7% 48 Table 2. Summary of laboratory measurements. CB-S, thick-bedded chert with stylolite; C-B, chert with breccias; CB, pure thick-bedded chert; CL-D, laminated chert with dolomite; CB-BB, thick-bedded chert with breccias. WELL NAME SAMPLE NUMBER DEPTH (feet) POROSITY BULK DEN (g/cc) GRAIN DEN (g/cc) GRAIN MOD (G Pa) LITHOLOGY 161 161 161 162 162 162 162 162 162 162 2 3 6 2 3 7 8 10 11 12 8499.00 8537.00 9042.00 8531.00 8553.00 8952.00 9014.00 9096.00 9147.00 9175.00 22.20% 5.90% 27.80% 23.30% 11.20% 21.60% 15.40% 11.40% 15.00% 0.60% 2.051 2.464 1.916 2.017 2.343 2.056 2.230 2.331 2.222 2.579 2.640 2.620 2.640 2.640 2.640 2.620 2.640 2.630 2.610 2.590 39.0 49.3 39.0 39.0 39.0 54.3 39.0 44.8 39.0 47.5 CB-S C-B CB-S CB-S CB-BB CB-P CB-S CB-S CB-S CL-D Table 3. Measured and calculated density. WELL NAME SAMPLE NUMBER 161 161 161 162 162 162 162 162 162 162 2 3 6 2 3 7 8 10 11 12 BULK DENSITY GRAIN DENSITY dry (g/cc) (g/cc) 2.051 2.464 1.916 2.017 2.343 2.056 2.230 2.331 2.222 2.579 2.640 2.620 2.640 2.640 2.640 2.620 2.640 2.630 2.610 2.590 49 BRINE SATURATION DENSITY (g/cc) OIL SATURATION DENSITY (g/cc) 2.29 2.53 2.21 2.26 2.46 2.29 2.39 2.45 2.38 2.58 2.19 2.50 2.09 2.16 2.41 2.19 2.33 2.40 2.32 2.58 Table 4. Measured velocity and calculated moduli for dry samples. Zp, Zs, K, G represents P-wave impedance, S-wave impedance, Bulk Modulus and Shear Modulus. WELL NAME SAMPLE NUMBER Vp (km/s) tp (us/ft) Vs (km/s) ts (us/ft) VP/VS 161 161 161 162 162 162 162 162 162 162 2 3 6 2 3 7 8 10 11 12 4.14 5.34 3.68 4.01 5.13 4.32 4.50 5.24 4.59 5.70 73.62 57.11 82.76 75.93 59.42 70.57 67.71 58.16 66.46 53.48 2.58 3.45 2.28 2.50 3.28 2.69 2.74 3.36 2.80 3.61 118.33 88.23 133.67 121.76 93.01 113.36 111.22 90.71 108.66 84.43 1.61 1.54 1.62 1.60 1.57 1.61 1.64 1.56 1.64 1.58 Table 5. POISSON'S Zp Zs RATIO (g*km/cc*s) (g*km/cc*s) 0.18 0.14 0.19 0.18 0.16 0.18 0.21 0.15 0.20 0.16 8.49 13.15 7.06 8.10 12.02 8.88 10.04 12.22 10.19 14.70 5.28 8.51 4.37 5.05 7.68 5.53 6.11 7.83 6.23 9.31 K Gpa G Gpa 17.01 30.98 12.71 15.65 28.10 18.53 22.87 28.94 23.43 38.95 13.61 29.41 9.96 12.64 25.16 14.86 16.75 26.32 17.48 33.61 Calculated velocity and moduli of water saturated chert. Zp, Zs, K, G represents P-wave impedance, S-wave impedance, Bulk Modulus and Shear Modulus. WELL NAME SAMPLE NUMBER Vp (km/s) tp (us/ft) Vs (km/s) ts (us/ft) VP/VS 161 161 161 162 162 162 162 162 162 2 3 6 2 3 7 10 11 12 4.13 5.47 3.71 4.03 5.08 4.38 5.23 4.56 5.89 73.75 55.73 82.08 75.71 59.99 69.57 58.33 66.78 51.79 2.44 3.41 2.12 2.36 3.20 2.55 3.28 2.71 3.61 124.97 89.35 143.63 129.03 95.35 119.53 93.05 112.50 84.53 1.69 1.60 1.75 1.70 1.59 1.72 1.60 1.68 1.63 Table 6. POISSON'S Zp RATIO (g*km/cc*s) 0.23 0.18 0.26 0.24 0.17 0.24 0.18 0.23 0.20 9.45 13.82 8.21 9.12 12.51 10.02 12.82 10.87 15.21 Zs (g*km/cc*s) K Gpa G Gpa 5.58 8.62 4.69 5.35 7.87 5.83 8.04 6.45 9.32 20.93 36.39 17.22 19.85 30.02 24.06 31.89 26.31 44.72 13.61 29.41 9.96 12.64 25.16 14.86 26.32 17.48 33.61 Calculated velocity and moduli of oil saturated chert. Zp, Zs, K, G represents P-wave impedance, S-wave impedance, Bulk Modulus and Shear Modulus. WELL NAME SAMPLE NUMBER Vp (km/s) tp (us/ft) Vs (km/s) ts (us/ft) VP/VS 161 161 161 162 162 162 162 162 162 162 2 3 6 2 3 7 8 10 11 12 4.05 5.34 3.59 3.93 5.19 5.19 4.24 5.19 5.19 5.19 75.25 57.05 85.00 77.64 58.77 58.77 71.85 58.77 58.77 58.77 2.49 3.43 2.18 2.42 3.31 3.31 2.60 3.31 3.31 3.31 122.26 88.89 139.59 126.06 92.09 92.09 117.01 92.09 92.09 92.09 1.62 1.56 1.64 1.62 1.57 1.57 1.63 1.57 1.57 1.57 50 POISSON'S Zp RATIO (g*km/cc*s) 0.20 0.15 0.21 0.19 0.16 0.16 0.20 0.16 0.16 0.16 8.87 13.36 7.49 8.49 12.51 11.36 9.29 12.46 12.01 13.39 Zs (g*km/cc*s) K Gpa G Gpa 5.46 8.58 4.56 5.23 7.99 7.25 5.71 7.95 7.66 8.55 17.77 32.18 13.58 16.47 29.65 26.92 19.60 29.53 28.46 31.74 13.61 29.41 9.96 12.64 26.43 24.00 14.86 26.32 25.37 28.29 REFERENCES Batzle, M. L., and Wang, Z.-J., 1992, Seismic properties of pore fluids: Geophysics, 57, 1396–1408. Blumentritt, C.H., Marfurt, K.J., and Sullivan, E.C., 2005, Volume based curvature attributes illuminate fracture orientations, Lower Mid Paleozoic, Central Basin Platform, West Texas, 2004: submitted to Geophysics. Gassmann, F., 1951, Elastic waves through a packing of spheres: Geophysics, 16, 673-685. Han, D.-H., 1986, Nur, A., and Morgan, D., 1986, Effects of porosity and clay content on wave velocities in sandstones: Geophysics, 51, 2093-2107 Hart, B. S., Pearson, R., and Rawling, G. C., 2002, 3-D seismic horizon-based approaches to fracture-swarm sweet spot definition in tight-gas reservoirs: The Leading Edge, 21, 28-35. Kalkomey, C. T., 1997, Potential risks when using seismic attributes as predictors of reservoir properties: The Leading Edge, 16, 247-251. Kallweit, R.S. and Wood, L.C, 1982, The limits of resolution of zero-phase wavelets: Geophysics, 47, 1035-1046. Latimer, R.B., Davidson, R., and Riel, P.V., 2000, An interpreter’s guide to understanding and working with seismic-derived acoustic impedance data, The Leading Edge, 19, 242-256. 51 Lisle, R. J., 1994, Detection of zones of abnormal strains in structures using Gaussian curvature analysis: AAPG Bulletin, 79, 1811-1819. Marfurt, K. J., R. L., Kirlinz, Farmer, S. L., and Bahorich, M. S., 1998, 3-D seismic attributes using a semblance-based coherency algorithm, Geophysics, 63, 1150–1165. Marfurt, K. J., 2005, Robust estimates of reflector dip and azimuth: submitted to Geophysics. Roberts, A., 2001. Curvature attributes and their application to 3D interpreted horizons. First Break, 19, 85-100. Rogers J. P., and M. W. Longman, 2001, An introduction to chert reservoirs in North America, AAPG Bulletin, 85, 1-5. Ruppel, S. C. and Barnaby R. J., 2001, Contrasting styles of reservoir development in proximal and distal chert facies: Devonian Thirtyone Formation, Texas, AAPG Bulletin, 85, 7-33. Ruppel S. C. and Hovorka, S. D., 1995, Controls on Reservoir Development in Devonian Chert: Permian Basin, Texas, AAPG Bulletin, 79, 1757-1785. Russell, B.H., 1988, Introduction to seismic inversion methods, Society of Exploration Geophysicists. Russell, B.H., and Lindseth, R.O., 1982, The information content of synthetic sonic logs – A frequency domain approach: presented at the 1982 convention of the EAEG, Cannes, France 52 Sylvester, A.G., 1988. Strike slip faults. Geological Society of America Bulletin, 100, 1666–1703. 53
