Solved problems – 4th exercise
advertisement

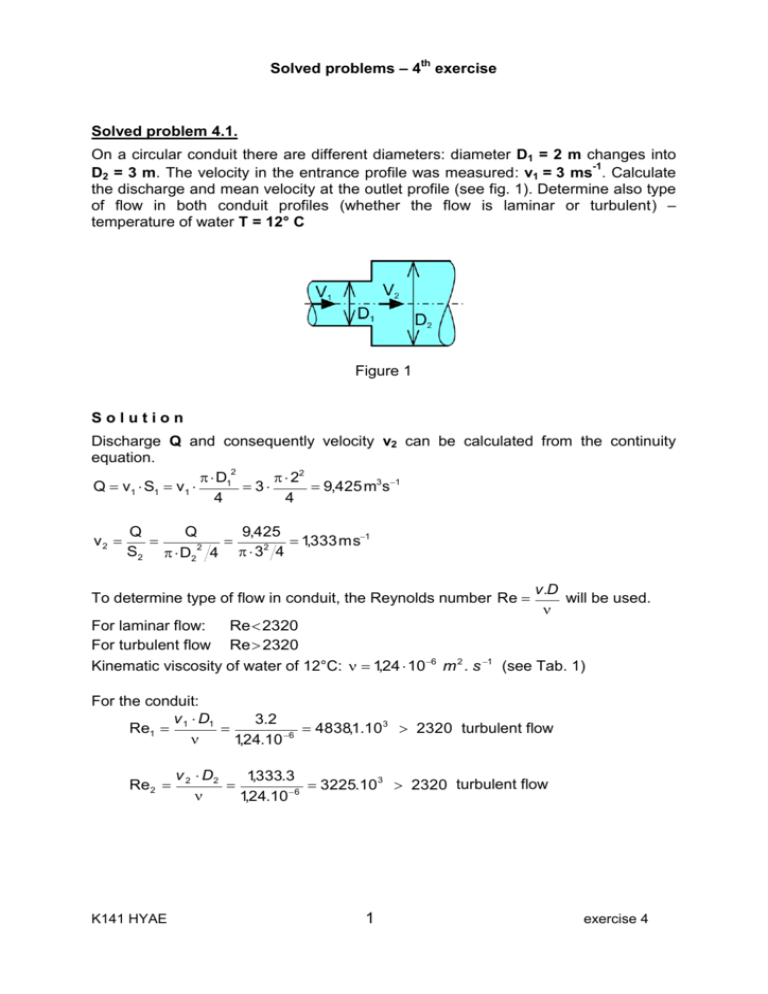
Solved problems – 4th exercise Solved problem 4.1. On a circular conduit there are different diameters: diameter D1 = 2 m changes into -1 D2 = 3 m. The velocity in the entrance profile was measured: v1 = 3 ms . Calculate the discharge and mean velocity at the outlet profile (see fig. 1). Determine also type of flow in both conduit profiles (whether the flow is laminar or turbulent) – temperature of water T = 12° C Figure 1 Solution Discharge Q and consequently velocity v2 can be calculated from the continuity equation. 2 D1 22 Q v1 S1 v1 3 9,425 m3s1 4 4 v2 Q Q 9,425 1,333 ms1 2 S 2 D2 4 3 2 4 To determine type of flow in conduit, the Reynolds number Re v.D will be used. For laminar flow: Re 2320 For turbulent flow Re 2320 Kinematic viscosity of water of 12°C: 1,24 10 6 m 2 . s 1 (see Tab. 1) For the conduit: v D 3.2 Re1 1 1 4838,1.10 3 2320 turbulent flow 6 1,24.10 Re 2 K141 HYAE v 2 D2 1,333.3 3225.10 3 2320 turbulent flow 6 1,24.10 1 exercise 4 Solved problem 4.2. A horizontal pipeline is attached to the wall of reservoir (see fig. 2). The pipeline has different profiles. The water level in the upper reservoir is in the height H = 1.5 m above the pipeline axis. From the lower end of the pipeline water flows out to the open space. Diameters and lengths of pipeline reaches are: D1 = 0.24 m, L1 = 3 m, D2 = 0.1 m, L2 = 1 m, D3 = 0.12 m, L3 = 2 m. Calculate discharge in the pipeline and draw the course of energy line (EL) and pressure line (PL). Resolve the problem: a) Neglecting losses (i.e. consider the liquid to be ideal) b) Considering losses for water of temperature 10°C. Steel pipeline consider to be after usage (slightly rusted). Figure 2 Solution a) Neglecting losses Bernoulli equation (BE) and continuity equation will be used to solve the problem. Using BE to calculate discharge, it will be the most convenient to state the datum (reference) level at the axis of the horizontal pipe, and to write then BE for the upper water level (profile 0 pressure on the level is known - pa), and for the centre of outlet profile 3 (its position, referred to the datum level, is h = 0). The upper reservoir can be considered to be large (its dimensions are not mentioned because they have no importance) and the effect of approach velocity un can be therefore neglected (i.e. vn = 0). Then: 2 2 BE 0 – 3: H pa v n p v 0 a 3 g 2g g 2g Arranging this equation, mean velocity in outlet profile can be calculated v 3 2gH 2 9,81 1,5 5,42m . s 1 Mass discharge is calculated from continuity equation 0,12 2 Q v 3 S3 5,42 0,061m 3 . s 1 4 Now it is possible to use continuity equation again, to calculate velocities in other profiles and to calculate thus also corresponding velocity heads. Q 4 0,061 v1 1,356 m . s 1 , S1 0,24 2 K141 HYAE 2 2 v1 1,3562 0,094 m 2g 19,62 exercise 4 2 Q 4 0,061 v2 7,812 m . s 1 2 S2 0,1 v2 7,8122 3,110 m 2g 19,62 As diameters in the single reaches of the pipeline are constant, also velocities are constant in these reaches. The energy line and pressure line will therefore be parallel and, because of considering the liquid to be ideal, they will be horizontal. Then the BE can be written for 2 profiles - the first one situated at the water level of the upper reservoir, the second one situated e.g. in the middle of length of the first reach of pipe (static pressure there is still unknown): 2 BE 0 – 1: p p v H a 0 0 1s 2 g g 2g after its rearrangement: 2 p pa p1 v 1s H 1 1,5 0,094 1,406 m g g 2g Similarly, for the second reach of the pipeline: 2 p pa p2 v 2s H 2 1,5 3,110 1,61m g g 2g (overpressure head) (underpressure head) In the outlet profile there is the atmospheric pressure which, in this case, will be also in the whole length of the last pipe reach. Both velocities and pressures are constant in single reaches of pipeline, energy and pressure lines are therefore parallel, as mentioned. In profiles, where the pipe diameters change, the pressure line changes its position suddenly. Energy line and pressure line are seen on fig. 3. Figure 3 K141 HYAE 3 exercise 4 b) Considering losses As in a), Bernoulli equation and continuity equation will be used to solve the problem. To calculate discharge, the most advantages procedure again is to write Bernoulli equation for profile of water level in reservoir (profile 0) and for outlet profile (profile 3). The datum level can be considered at the axis of the horizontal pipe. The upper reservoir can be considered to be large and the effect of approach velocity can be neglected (i.e. vn = 0). Considering the Coriolis number = 1,0, it can be then written: 2 H 2 pa v n p v 0 a 3 Z g 2g g 2g Losses Z are calculated as a sum of friction losses Zt and local losses Zm. Friction L v2 loss is expressed by Darcy-Weisbach equation Z t , local loss can be D 2g v2 expressed as , where is coefficient of local loss and v is mean velocity of flow 2g in the profile of pipe fitting. The coefficient of friction loss can be determined using v D Moody diagram, in dependency on Reynolds number Re ( ... kinematic viscosity of flow of liquid) and in dependency on relative roughness ( ... hydraulic D roughness of a pipe). Coefficients of local losses: inlet to pipeline: inlet = 0,5 (related to velocity behind the inlet) D2 0,1 0,417 contr . 0,35 D1 0,24 contraction of pipe from D1 to D2: (related to diameter D2) enlargement of pipe from D2 to D3: D3 0,12 1,2 enl arg . 0,19 D2 0,1 (related to diameter D3) Coefficients of friction loss: As neither discharge nor velocities of flow in single reaches are known, it is not possible to state values of Reynolds numbers in advance. That is why in the first step of calculation coefficients of friction losses i will be determined for single reaches only according relative roughness i , supposing rough turbulent quadratic zone of Di friction losses. Mean hydraulic roughness for given pipes (steel pipe after usage slightly rusted) is 0,5 mm. From Moody diagram – values of coefficients of friction losses in single reaches are: K141 HYAE 4 exercise 4 reach 1: 1 0,5 0,00208 D1 240 reach 2: 2 0,5 0,0050 D2 100 reach 3: 3 0,5 0,00417 D3 120 1 0,024 , 2 0,030 , 3 0,029 . Bernoulli equation for profile of water level in reservoir and for profile at the end of the third reach can be written as 2 2 v v H 3 1 2g 2g 2 L1 v 2 inlet 1 D1 2g 2 L2 v 3 contr . 2 D2 2g L enl arg . 3 3 D3 Velocities vi in single reaches can be expressed, following continuity equation, from 2 Di discharge Q and from cross section areas, S i : 4 H Q2 2 S3 2g L3 L1 L2 Q2 Q2 inlet 1 contr . 2 enl arg . 3 2 2 2 D1 S2 2g D2 S3 2g D3 S1 2g Q2 From Bernoulli equation arranged in this form it is possible to express discharge Q: Q H12 1 1 S 2 2g S 2 2g 1 3 L 1 inlet 1 1 2 D1 S 2 2g L 1 contr . 2 2 2 D2 S3 2g L enl arg . 3 3 D3 Q 0,0350 m 3 . s 1 Now it is necessary to verify values of coefficients of friction losses – in the first step of calculations determined under the presumption of rough turbulent quadratic zone (kinematic viscosity of water with temperature of 10°C 1,31 10 6 m 2 s 1 ): Re1 Re2 Re3 K141 HYAE v 1 D1 Q D1 0,0350 0,24 1,42 10 5 2 S1 0,24 1,31 10 6 4 v 2 D2 Q D2 0,0350 0,10 3,40 105 2 S2 0,10 1,31 106 4 v 3 D3 Q D3 0,0350 0,12 2,83 105 S3 0,122 1,31 10 6 4 5 1 0,025 2 0,031 2 0,029 exercise 4 12 As values of coefficient of friction losses for the first and second pipe reach differ from those ones calculated previously, it is necessary to recalculate discharge Q with these changed values – using the same procedure of calculation: Q 0,0349 m 3 . s 1 As the recalculated value of discharge differs only little compared with value obtained from the first step of calculation (approx. about 0,3 %), it is not necessary to make further corrections of coefficients of friction losses and the discharge Q 0,0349 m 3 . s 1 can be considered to be the final result. Energy line (EL) in this case comes out from water level in reservoir (energy horizon) and in direction of flow decreases because of losses. Pressure line (PL) is in lower position, its vertical distance from EL is given by value of velocity head. As there are constant velocities of flow in single reaches, the energy line and pressure line are parallel (see scheme - fig. 4). Figure 4 K141 HYAE 6 exercise 4 Solved problem 4.3. Water flows in the pipeline (see fig. 5). Calculate maximum velocity umax in the pipe axis and discharge Q. Determine whether the flow is laminar or turbulent (T = 12oC). The mercury differential manometer (Hg = 13600 kgm-3) shows the difference between levels in Pitot tube Hm = 0,02 m. Diameter of the pipe is D = 0,15 m. Velocity coefficient of Pitot tube is = 1,0. Mean velocity is considered to be v = 0,84 umax. Figure 5 Solution As the flow is steady, discharge Q is constant. Diameter of the pipe is also constant, therefore velocity is constant, too. Pitot tube serves to measure point velocities. The principal lies in a change of type of mechanical energy between two profiles (Bernoulli equation) – change of velocity head causes a change of pressure head. The difference between velocity heads in profiles 1 and 2 (in profile 2 the velocity head is given by velocity umax , in profile 2 the velocity head is zero, because in manometer there is no velocity) will cause a difference between pressure heads. Consequently, it causes a change in mercury levels in manometer. To determine the point velocity, combination of equation of pressure balance (at convenient surface area in manometer) will be used in combination with Bernoulli equation for profiles 1 and 2. Determination of pressure difference (balance of static pressures at surface area): p1 Hg g H m p2 w g H m p1 p2 H m g Hg w p1 p2 Hm w g Hg 1 w (1) Figure 6 K141 HYAE 7 exercise 4 Determination of point velocity (from Bernoulli equation for profiles 1 and 2, datum level at pipe axis): 2 . u max p1 p u2 2 Z12 , where the loss Z12 . max , 2 .g .g 2. g . g after equation arrangement, including introduction of a new coefficient 1 , it comes to u max . 2 . g p 2 p1 . g (2) If loss is neglected, ς = 0 φ = 1, combination of equations (1) and (2) gives Hg u max . 2 . g . H m 1 1. 2.9,81.0,02.13,6 1 2,224 m .s 1 w Using the relation between point and mean velocity v = 0,84 umax, mean velocity will be determined and, consequently, continuity equation will be used to calculate discharge Q. v 0,84.u max 1,868 m.s 1 Q v .S 1,868. .D 2 0,033 m 3 . s 1 4 Flow regime will be determined using the Reynolds number: Re v .D 1,868.0,15 225 943 1,24.10 6 The value of Reynolds number Re > 2320 flow in the pipeline is turbulent. K141 HYAE 8 exercise 4


