ACT Science 2, Set 2 Answers & Explanations
advertisement
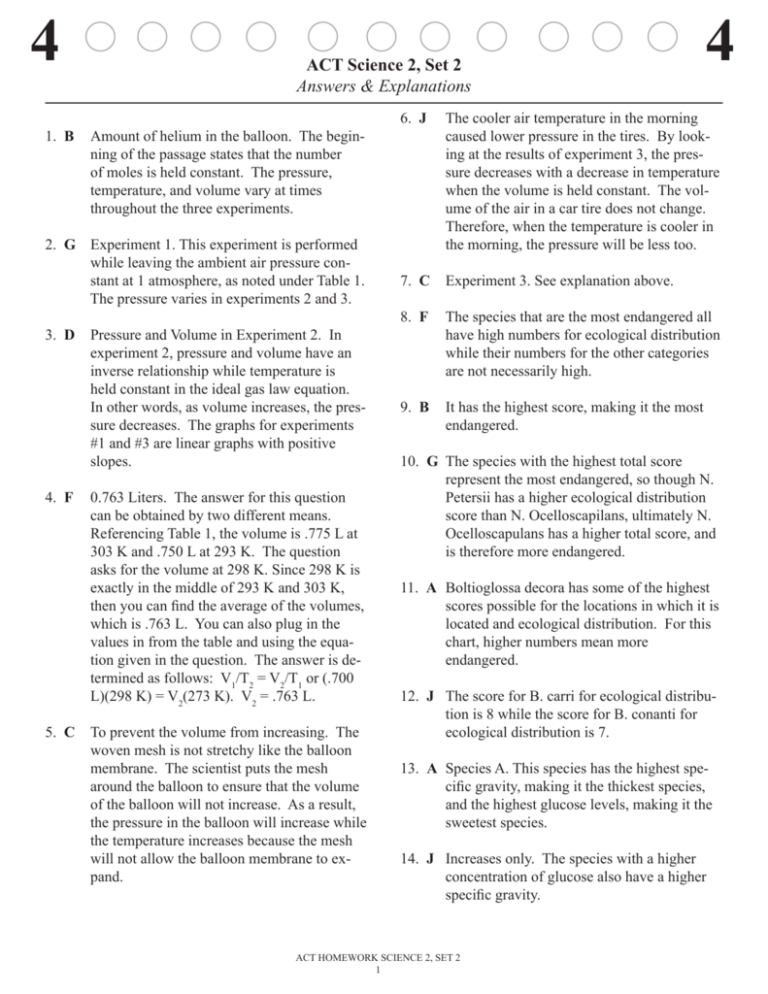
4 ACT Science 2, Set 2 Answers & Explanations 1. B Amount of helium in the balloon. The beginning of the passage states that the number of moles is held constant. The pressure, temperature, and volume vary at times throughout the three experiments. 2. G Experiment 1. This experiment is performed while leaving the ambient air pressure constant at 1 atmosphere, as noted under Table 1. The pressure varies in experiments 2 and 3. 3. D Pressure and Volume in Experiment 2. In experiment 2, pressure and volume have an inverse relationship while temperature is held constant in the ideal gas law equation. In other words, as volume increases, the pressure decreases. The graphs for experiments #1 and #3 are linear graphs with positive slopes. 4. F 0.763 Liters. The answer for this question can be obtained by two different means. Referencing Table 1, the volume is .775 L at 303 K and .750 L at 293 K. The question asks for the volume at 298 K. Since 298 K is exactly in the middle of 293 K and 303 K, then you can find the average of the volumes, which is .763 L. You can also plug in the values in from the table and using the equation given in the question. The answer is determined as follows: V1/T2 = V2/T1 or (.700 L)(298 K) = V2(273 K). V2 = .763 L. 5. C To prevent the volume from increasing. The woven mesh is not stretchy like the balloon membrane. The scientist puts the mesh around the balloon to ensure that the volume of the balloon will not increase. As a result, the pressure in the balloon will increase while the temperature increases because the mesh will not allow the balloon membrane to expand. 6. J 4 The cooler air temperature in the morning caused lower pressure in the tires. By looking at the results of experiment 3, the pressure decreases with a decrease in temperature when the volume is held constant. The volume of the air in a car tire does not change. Therefore, when the temperature is cooler in the morning, the pressure will be less too. 7. C Experiment 3. See explanation above. 8. F The species that are the most endangered all have high numbers for ecological distribution while their numbers for the other categories are not necessarily high. 9. B It has the highest score, making it the most endangered. 10. G The species with the highest total score represent the most endangered, so though N. Petersii has a higher ecological distribution score than N. Ocelloscapilans, ultimately N. Ocelloscapulans has a higher total score, and is therefore more endangered. 11. A Boltioglossa decora has some of the highest scores possible for the locations in which it is located and ecological distribution. For this chart, higher numbers mean more endangered. 12. J The score for B. carri for ecological distribu tion is 8 while the score for B. conanti for ecological distribution is 7. 13. A Species A. This species has the highest spe cific gravity, making it the thickest species, and the highest glucose levels, making it the sweetest species. 14. J Increases only. The species with a higher concentration of glucose also have a higher specific gravity. ACT HOMEWORK SCIENCE 2, SET 2 1 4 4 15. D The November species from species D. The highest water content is likely to be found in the sample with the lowest specific gravity, because that means its density is closest to water. 20. J Looking at the chart with experiment 3, there are some metals that go down by 0.1 while some go down 0.7. How much a metal ac cepts lubrication depends on the metal’s properties. 16. H The November sample from species D. This sample has the lowest specific gravity, and therefore the lowest weight relative to water. 21. A This will determine, much more than the other answers, where the best materials for the ball bearings will be. 17. D No, because there is no relationship between sap sample volumes and color value. While some of the samples with a high volume had darker colors than those with less volume, there is not a clear pattern to support the hy pothesis. 22. F It has the lowest coefficient of them all. 18. F Species A. The sap color is within the ex pected range for both species A and C. How ever, only species A demonstrated a specific gravity as high as 3.732. 19. C The passage provides no information regarding the hardness of the alloys nor about how they can be determined. 23. A This does not affect the coefficient, which is the same for all of the metal, regardless of how much is present. 24. H Brass has much lower numbers than lead when used with alloy B. 25. D Relative roughness or smoothness would have a lot to do with the friction coefficient. The more rough a material is, the less it is go ing to slide. ACT HOMEWORK SCIENCE 2, SET 2 2

