Spectrophotometer Lab
advertisement
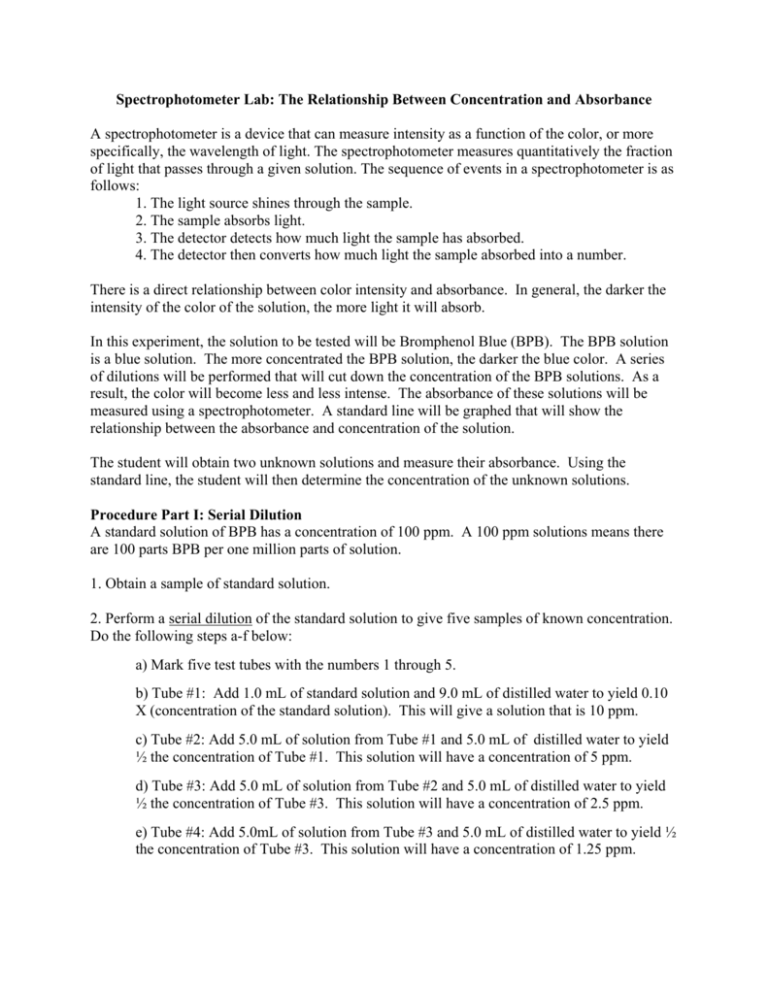
Spectrophotometer Lab: The Relationship Between Concentration and Absorbance A spectrophotometer is a device that can measure intensity as a function of the color, or more specifically, the wavelength of light. The spectrophotometer measures quantitatively the fraction of light that passes through a given solution. The sequence of events in a spectrophotometer is as follows: 1. The light source shines through the sample. 2. The sample absorbs light. 3. The detector detects how much light the sample has absorbed. 4. The detector then converts how much light the sample absorbed into a number. There is a direct relationship between color intensity and absorbance. In general, the darker the intensity of the color of the solution, the more light it will absorb. In this experiment, the solution to be tested will be Bromphenol Blue (BPB). The BPB solution is a blue solution. The more concentrated the BPB solution, the darker the blue color. A series of dilutions will be performed that will cut down the concentration of the BPB solutions. As a result, the color will become less and less intense. The absorbance of these solutions will be measured using a spectrophotometer. A standard line will be graphed that will show the relationship between the absorbance and concentration of the solution. The student will obtain two unknown solutions and measure their absorbance. Using the standard line, the student will then determine the concentration of the unknown solutions. Procedure Part I: Serial Dilution A standard solution of BPB has a concentration of 100 ppm. A 100 ppm solutions means there are 100 parts BPB per one million parts of solution. 1. Obtain a sample of standard solution. 2. Perform a serial dilution of the standard solution to give five samples of known concentration. Do the following steps a-f below: a) Mark five test tubes with the numbers 1 through 5. b) Tube #1: Add 1.0 mL of standard solution and 9.0 mL of distilled water to yield 0.10 X (concentration of the standard solution). This will give a solution that is 10 ppm. c) Tube #2: Add 5.0 mL of solution from Tube #1 and 5.0 mL of distilled water to yield ½ the concentration of Tube #1. This solution will have a concentration of 5 ppm. d) Tube #3: Add 5.0 mL of solution from Tube #2 and 5.0 mL of distilled water to yield ½ the concentration of Tube #3. This solution will have a concentration of 2.5 ppm. e) Tube #4: Add 5.0mL of solution from Tube #3 and 5.0 mL of distilled water to yield ½ the concentration of Tube #3. This solution will have a concentration of 1.25 ppm. f) Tube #5: Add 0.5mL of solution from Tube #4 and 5.0 mL of distilled water to yield ½ the concentration of Tube #4. This solution will have a concentration of 0.625 ppm. 3. Arrange your test tubes in order of decreasing concentration of BPB and note the color in each dilution. Procedure Part II: Determine the Absorbance After setting the spectrophotometer to 0 absorbance (100% transmittance) at 580 nm with a cuvette containing water (blank), measure the absorption of the samples in sample tubes #1- #5 at 580 nm. Remember to reset the machine with the water blank after each reading. 1. Set the Spec-20 (spectrophotometer) to a wavelength of 580 nanometers. 2. Zero the Spec-20 using water as the blank. 3. Read the absorbance of your solutions from LOWEST concentration to highest concentration. Pour the solution from tube #5 into a clean dry cuvette. Place the cuvette into the Spec-20 making sure the white mark on the cuvette lines up with the mark on the sample chamber on the Spec-20. Wipe any fingerprints from the outside of the cuvette with a lint free Kim-wipe. DO NOT USE PAPER TOWELS. Record the absorbance in the data table. 4. Pour the solution from the cuvette back in to its original test tube. 5. Dry the cuvette with a lint free Kim-wipe. 6. Repeat steps 3-5 for the remaining four diluted standard solutions. Determine the absorbance of test tube #4, then #3, then #2, and last is #1. Procedure Part III: Graphing the Standard Line Plot the absorbance (y-axis) versus concentration of the BPB (x-axis). Draw a best fit line using your data points. You now have a working relationship between the absorbance and the concentration of BPB. Obtain two solutions of BPB of unknown concentration from your instructor. Again, using the water blank to set the instrument at 0 absorbance, determine the concentration of your unknown sample using the standard line that you have generated. Pre-Lab Questions: 1. 2. 3. 4. 5. How does a spectrophotometer work? What is the relationship between color intensity and the absorbance of a solution? What is the concentration of a standard solution of BPB? What does it mean for a solution to have a concentration of 10 ppm? What are the objectives for this lab? Spectrophotometer Lab: The Relationship Between Concentration and Absorbance Data Table 1: Absorbance of Serial Dilutions Solution Concentration (ppm) Tube #1 10.0 Tube #2 5.0 Tube #3 2.5 Tube #4 1.25 Tube #5 0.625 Data Table 2: Absorbance of Unknown Solutions Unknown Solution # Absorbance Absorbance Concentration Determined from Graph Post Lab Questions 1. Explain the procedure for determining the concentrations of the unknown solution. 2. Why must the standard line be a best fit that that passes through the origin? 3. Explain possible sources of error in the procedure.

