One-Way Analysis of Variance
advertisement

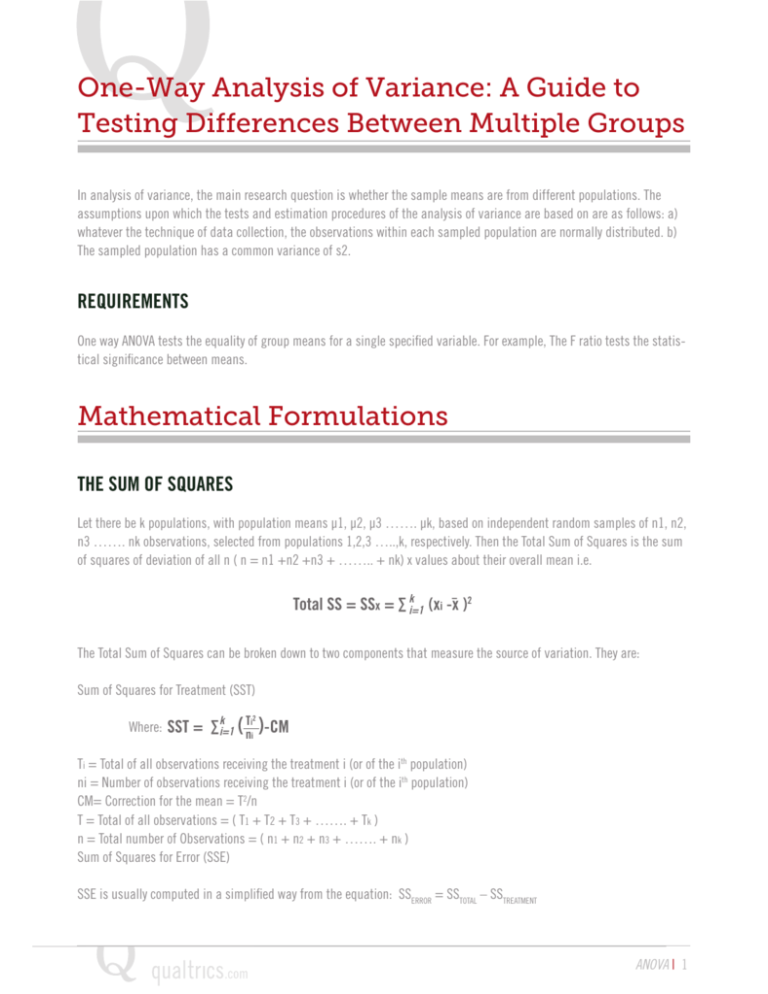
One-Way Analysis of Variance: A Guide to Testing Differences Between Multiple Groups In analysis of variance, the main research question is whether the sample means are from different populations. The assumptions upon which the tests and estimation procedures of the analysis of variance are based on are as follows: a) whatever the technique of data collection, the observations within each sampled population are normally distributed. b) The sampled population has a common variance of s2. REQUIREMENTS One way ANOVA tests the equality of group means for a single specified variable. For example, The F ratio tests the statistical significance between means. Mathematical Formulations THE SUM OF SQUARES Let there be k populations, with population means µ1, µ2, µ3 ……. µk, based on independent random samples of n1, n2, n3 ……. nk observations, selected from populations 1,2,3 …..,k, respectively. Then the Total Sum of Squares is the sum of squares of deviation of all n ( n = n1 +n2 +n3 + …….. + nk) x values about their overall mean i.e. Total SS = SSx = ∑ ki=1 (xi -xˉ )2 The Total Sum of Squares can be broken down to two components that measure the source of variation. They are: Sum of Squares for Treatment (SST) Where: SST = ∑ ki=1 ( Tnii )-CM 2 Ti = Total of all observations receiving the treatment i (or of the ith population) ni = Number of observations receiving the treatment i (or of the ith population) CM= Correction for the mean = T2/n T = Total of all observations = ( T1 + T2 + T3 + ……. + Tk ) n = Total number of Observations = ( n1 + n2 + n3 + ……. + nk ) Sum of Squares for Error (SSE) SSE is usually computed in a simplified way from the equation: SSERROR = SSTOTAL – SSTREATMENT ANOVA | 1 THE DEGREES OF FREEDOM The degrees of freedom for the Total Sum of Squares is always (n – 1); where n = Total number of observations in all samples = ( n1 + n2 + n3 + ……. + nk ) The degrees of freedom of the Model (Treatment) is always (k – 1); where k = Total number of populations being analyzed. The degrees of freedom of the Error is always (n – k). The following relationship always holds: D.F.(Treatment) + D.F.(ERROR) = (k-1) + (n-k) = (n-1) = D.F.(TOTAL SS) THE MEAN SQUARE The mean square gives an estimate of the s² based on the variation among the sample means (corresponding to the model) and the variation within the samples (corresponding to the error). These estimates are calculated by dividing the sum of squares by the corresponding degrees of freedom. Thus, The Mean Square for Treatment (Model) = MST = (SST)/(k-1) The Mean Square of the Error = MSE = (SSE)/(n-k) (The MSE is a pooled estimate of s2 based on the sum of squares of deviations of the x-values about their respective sample means and is also denoted by s2.) THE F STATISTIC The F statistic is used for comparing the estimate of s2 (MS(Treatment)) and the s2 (MS(Error)) and is given by F = MS(Treatment)/MS(Error). The Analysis The ANOVA is done with the Ho: μ1 = μ2 = μ3 = …..= μk Next, using the tables, the F-value with degrees of freedom v1 (v1 = D.F. of the numerator i.e. of MS(Treatment) = k-1) and v2 (v2 = D.F. of the denominator i.e. of MS(Error) = n-k), and for the significance level used in the analysis, is obtained. ANOVA | 2 This F-value is compared with the F statistic computed. If the F-value obtained is greater than or equal to the F-Statistic Computed; then we say that THERE IS INSUFFICIENT EVIDENCE TO REJECT THE NULL HYPOTHESIS AT THE GIVEN LEVEL OF SIGNIFICANCE. But, if the F-value obtained is less than the F-Statistic Computed; then we say that THERE IS SUFFICIENT EVIDENCE TO REJECT THE NULL HYPOTHESIS AT THE GIVEN LEVEL OF SIGNIFICANCE and that leads to the conclusion that at least one of the population means (μi) is different from the others. The observed significance level is the significance level for which the F-value obtained from the table, corresponding to degrees of freedom v1 and v2, is equal to the F statistic computed. Another way of testing the null hypothesis is by using this observed significance level. If this significance level is less than or equal to the significance level set for the test, then the null hypothesis is rejected. We’re Here to Help! Qualtrics.com provides the most advanced online survey building, data collection (via panels or corporate / personal contacts), real-time view of survey results, and advanced “dashboard reporting tools”. If you are interested in learning more about how the Qualtrics professional services team can help you with a conjoint analysis research project, contact us at research@qualtrics.com. ANOVA | 3 ANOVA | 4 1. 2. 3. 4. The Degree of Freedom for the Regression Model, also called the explained model, is given by k, where k = number of independent variables in the regression equation. For the Residual, the error unexplained by the regression model, the Degree of Freedom is given by (n-k-1), where n = number of counts of the independent variable in the data set. Mean Square = (Sum of Squares)/(DF) F Ratio = (Mean Square of the Regression)/(Mean Square of the Residual) F-Prob = Level of significance corresponding to the F Value ANOVA | 5 ANOVA | 6


