Xenon Suboxides Stable under Pressure
advertisement
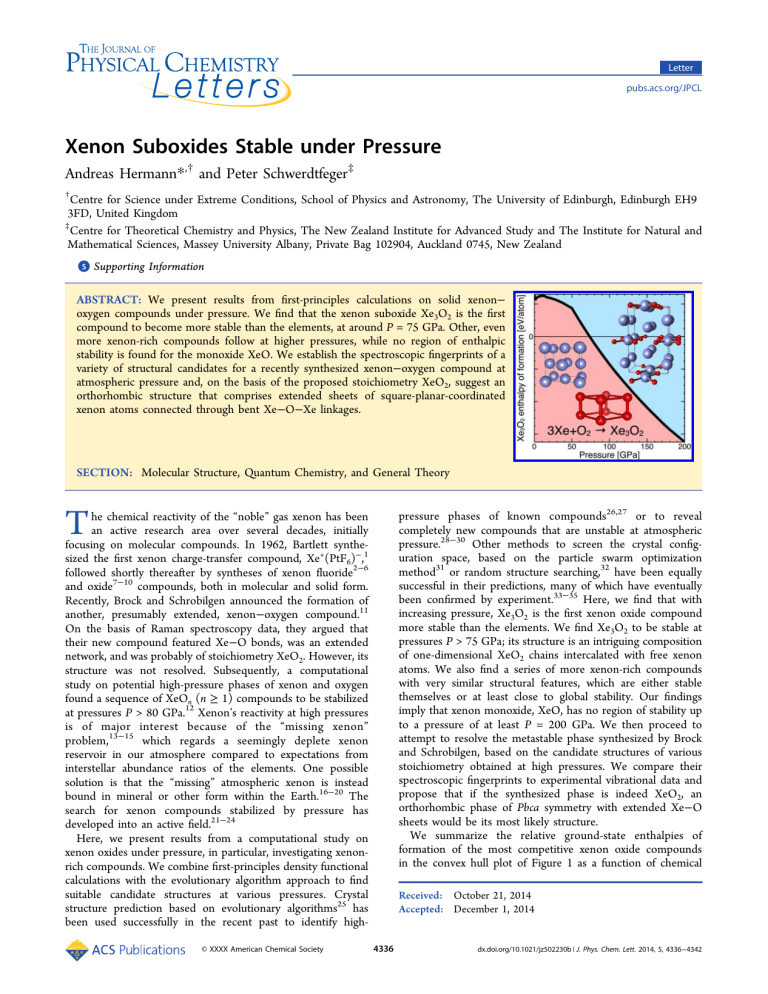
Letter pubs.acs.org/JPCL Xenon Suboxides Stable under Pressure Andreas Hermann*,† and Peter Schwerdtfeger‡ † Centre for Science under Extreme Conditions, School of Physics and Astronomy, The University of Edinburgh, Edinburgh EH9 3FD, United Kingdom ‡ Centre for Theoretical Chemistry and Physics, The New Zealand Institute for Advanced Study and The Institute for Natural and Mathematical Sciences, Massey University Albany, Private Bag 102904, Auckland 0745, New Zealand S Supporting Information * ABSTRACT: We present results from first-principles calculations on solid xenon− oxygen compounds under pressure. We find that the xenon suboxide Xe3O2 is the first compound to become more stable than the elements, at around P = 75 GPa. Other, even more xenon-rich compounds follow at higher pressures, while no region of enthalpic stability is found for the monoxide XeO. We establish the spectroscopic fingerprints of a variety of structural candidates for a recently synthesized xenon−oxygen compound at atmospheric pressure and, on the basis of the proposed stoichiometry XeO2, suggest an orthorhombic structure that comprises extended sheets of square-planar-coordinated xenon atoms connected through bent Xe−O−Xe linkages. SECTION: Molecular Structure, Quantum Chemistry, and General Theory he chemical reactivity of the “noble” gas xenon has been an active research area over several decades, initially focusing on molecular compounds. In 1962, Bartlett synthesized the first xenon charge-transfer compound, Xe+(PtF6)−,1 followed shortly thereafter by syntheses of xenon fluoride2−6 and oxide7−10 compounds, both in molecular and solid form. Recently, Brock and Schrobilgen announced the formation of another, presumably extended, xenon−oxygen compound.11 On the basis of Raman spectroscopy data, they argued that their new compound featured Xe−O bonds, was an extended network, and was probably of stoichiometry XeO2. However, its structure was not resolved. Subsequently, a computational study on potential high-pressure phases of xenon and oxygen found a sequence of XeOn (n ≥ 1) compounds to be stabilized at pressures P > 80 GPa.12 Xenon’s reactivity at high pressures is of major interest because of the “missing xenon” problem,13−15 which regards a seemingly deplete xenon reservoir in our atmosphere compared to expectations from interstellar abundance ratios of the elements. One possible solution is that the “missing” atmospheric xenon is instead bound in mineral or other form within the Earth.16−20 The search for xenon compounds stabilized by pressure has developed into an active field.21−24 Here, we present results from a computational study on xenon oxides under pressure, in particular, investigating xenonrich compounds. We combine first-principles density functional calculations with the evolutionary algorithm approach to find suitable candidate structures at various pressures. Crystal structure prediction based on evolutionary algorithms25 has been used successfully in the recent past to identify high- T © XXXX American Chemical Society pressure phases of known compounds26,27 or to reveal completely new compounds that are unstable at atmospheric pressure.28−30 Other methods to screen the crystal configuration space, based on the particle swarm optimization method31 or random structure searching,32 have been equally successful in their predictions, many of which have eventually been confirmed by experiment.33−35 Here, we find that with increasing pressure, Xe3O2 is the first xenon oxide compound more stable than the elements. We find Xe3O2 to be stable at pressures P > 75 GPa; its structure is an intriguing composition of one-dimensional XeO2 chains intercalated with free xenon atoms. We also find a series of more xenon-rich compounds with very similar structural features, which are either stable themselves or at least close to global stability. Our findings imply that xenon monoxide, XeO, has no region of stability up to a pressure of at least P = 200 GPa. We then proceed to attempt to resolve the metastable phase synthesized by Brock and Schrobilgen, based on the candidate structures of various stoichiometry obtained at high pressures. We compare their spectroscopic fingerprints to experimental vibrational data and propose that if the synthesized phase is indeed XeO2, an orthorhombic phase of Pbca symmetry with extended Xe−O sheets would be its most likely structure. We summarize the relative ground-state enthalpies of formation of the most competitive xenon oxide compounds in the convex hull plot of Figure 1 as a function of chemical Received: October 21, 2014 Accepted: December 1, 2014 4336 dx.doi.org/10.1021/jz502230b | J. Phys. Chem. Lett. 2014, 5, 4336−4342 The Journal of Physical Chemistry Letters Letter Figure 1. Convex hull plot of relative ground-state enthalpies of various xenon oxide phases for different pressures. Open symbols denote data points from ref 12. Figure 2. Structures of different xenon suboxides, all at P = 100 GPa. From top left: Immm-Xe3O2, C2/m-Xe2O, and Immm-Xe7O2. Xenon (oxygen) atoms are in blue (red), and Xe−O separations of less than 2.2 Å are drawn as connected. Numbers indicate partial charges from Bader analysis (see the text). composition. There, we present the enthalpy of formation per atom, ΔHf(XemOn) = (Hf(XemOn) − mHf(Xe) − nHf(O))/(m + n). In our ground-state calculations, we approximate the enthalpy of formation by the free energy, Hf ≈ F = E + pV. Each point on the convex hull plot denotes a phase stable against decomposition into the elements or other binary compounds, whereas all points above the hull are metastable, exhibiting an exothermic decomposition reaction. Figure 1 shows that at low pressures, no stable xenon oxides exist; that is expected. At P = 75 GPa, we find the first xenon oxide to become stable against the elements, the suboxide Xe3O2. We find several other xenon suboxides (Xe2O and Xe7O2) to become stable at a similar pressure. The stability of Xe3O2 means that xenon monoxide, XeO, is metastable toward the decomposition reaction 3XeO → Xe3O2 + 1/2O2; in contrast to ref 12, we do not find XeO to be stable at any pressure. Note that the convex hull almost forms a straight line on the xenonrich side of the phase diagram, indicating that a variety of phases of different stoichiometries are stable; this could imply that the structural “building blocks” of these structures are similar,36 and we shall discuss below that this is indeed the case. At around P = 110 GPa, the oxygen-rich compounds XeO2 and XeO3 suggested in ref 12 become stable and remain so up to at least P = 200 GPa. In Figure 2, we present the most stable structures of Xe3O2, Xe2O, and Xe7O2 at P = 100 GPa. All compounds feature onedimensional chains of XeO2 stoichiometry, with various amounts of intercalated xenon atoms. The xenon atoms in these chains are coplanar rectangularly coordinated to oxygen, and adjacent xenon atoms are connected by two bridging oxygen atoms. This is consistent with a presence of Xe4+ and O2− atoms within the chains.4,37 The geometry of these chains is very similar; at P = 100 GPa, the Xe−O separations are 2.06 (2.05−2.07, 2.04) Å in the most stable phase of Xe3O2 (Xe2O, Xe7O2), and the bridged Xe−Xe separations are 3.25 (3.22, 3.14) Å. Similar AX2 chains are found, for example, in the crystal structures of chromium dihalides, which contain an ionic component,38,39 and some alkali metal suboxides and alkaline earth subnitrides feature chains of fused M6O octahedra with intercalated free metal atoms.40−42 The proposed structure for pure XeO2 in the same pressure range, of P21/c symmetry,12 is made up entirely of the same chains; however, adding additional xenon atoms seemingly lowers the enthalpy per atom and stabilizes the suboxide phases with respect to XeO2 and pure xenon. What is the nature of this stabilization? We analyzed the projected atomic charges based on Bader’s topological analysis of the electron density43 and found significant charge transfer from the interstitial xenon atoms into the XeO2 chains, across all stable suboxide phases. The partial charges at P = 100 GPa obtained from Bader’s analysis are included in Figure 2. They support our structural interpretation of the formation of XeO2 chains, with large positive/negative partial charges on xenon/ oxygen. The free xenon atoms in Immm-Xe3O2 carry a charge of +0.23 electrons, which means that this compound features both strong ionic Xe−O bonding within the chains and weaker ionic Xe−O bonding involving the “free” xenon atoms. If the xenon content is increased, the partial charge on the free xenon atoms decreases. Most clearly visible in Xe7O2, the xenon partial charge correlates with the distance to the nearest oxygen atoms. In fact, in Xe7O2, xenon atoms farthest away from the XeO2 chains are quasi-neutral, and thus, one could expect a segregation into pure xenon and a more oxygen-rich compound to be enthalpically beneficial. A close inspection of the convex hulls in Figure 1 shows that Xe7O2 is actually on the border of instability; it is very close but just above the convex hull. It might be beyond the accuracy of our calculations to decide whether or not Xe7O2 is in fact stable; it could be the most xenon-rich compound that can reasonably form with isolated XeO2 chains, which seem to be the dominant structural feature in the most stable xenon-rich compounds that we found. The presence of two different xenon species, formally Xe4+ and Xe 0 , in these compounds allows for a different 4337 dx.doi.org/10.1021/jz502230b | J. Phys. Chem. Lett. 2014, 5, 4336−4342 The Journal of Physical Chemistry Letters Letter Figure 3. ELF of Immm-Xe3O2 at P = 100 GPa. (Left) Projections onto the unit cell walls, with the two shortest O−Xe separations indicated; rainbow colors range from blue (ELF = 0) to red (ELF = 1). (Middle) ELF along the paths indicated in the left panel (1, red; 2, green). (Right) ELF = 0.85 isosurface of one XeO4 unit of the XeO2 chains. interpretation, namely, that Xe0 acts as a Lewis base21 and terminal ligand to a cationic center, Xe4+. This bonding mechanism has so far been observed with the cations of gold and mercury only,44−46 with metal−xenon bond lengths of dM−Xe = 2.61−2.77 Å. Here, the shortest Xe4+−Xe0 separations (at P = 100 GPa) are d = 2.97−3.05 Å; there are eight of them per Xe4+ in each structure. However, the shortest O−Xe0 separations are d = 2.57−2.63 Å; therefore, the xenon suboxides could be seen as an example of Lewis base stabilization of the Lewis acid XeO2. We further analyzed the bonding in Xe3O2 by studying the electron localization function (ELF),47 which should give an indication of the presence of both covalent bonds and filled lone pairs. As seen in Figure 3, we essentially found the latter, the filled 5p lone pair on Xe4+ and the 2p lone pairs of O2−. The ELF along the O−Xe separation, both within the XeO2 chains and toward the nearest free xenon atoms, shows no intermediate maxima. The ELF around the free xenon atoms themselves is by all accounts spherical, indicating the absence of covalent interactions with other atoms and thus re-enforcing the picture of an ionic contribution to the overall bonding. If the XeO2 chains are nominally negatively charged, one could expect interesting electronic properties. Calculations with the hybrid HSE06 functional (including 25% screened exact exchange48) show that Immm-Xe3O2 has a relatively small electronic band gap, ∼0.1 eV at P = 100 GPa (using the semilocal PBE approximation for the exchange−correlation energy, we obtain a vanishing band gap). Figure 4 shows the electronic density of states (DOS) of Immm-Xe3O2, including projections of the DOS onto spherical atomic components. The valence and conduction bands from −12 to +5 eV are dominated by p electrons of oxygen and xenon, indicating a partial charge transfer from xenon to oxygen; empty bands of Xe p character attest to xenon’s cationic state, in particular, for the in-chain atoms; and empty O p bands show that the charge transfer to oxygen does not fill the O-2p orbitals completely. A lower valence band, from −26 to −15 eV, is made up of the filled s orbitals of both oxygen and xenon. Because we have found a wide array of xenon oxide compounds stable at high pressures, can we hazard a guess which of those (if any) was made as a metastable compound by Brock and Schrobilgen? We relaxed all xenon oxide candidate structures at P = 1 atm and, choosing the least unstable phase for each stoichiometry, determined their zone-center phonon frequencies; we attempted to avoid quasi-segregated phases with well-separated xenon atoms and O2 molecules. In Figure 5, Figure 4. Hybrid-DFT electronic DOS of Immm-Xe3O2 at P = 100 GPa. Projected DOSs for each atom type are shown; solid (dotted) lines indicate atomic p (s) contributions. The inset focuses on a smaller energy range around the band gap. we compare the computational results on the vibrational modes with the experimental Raman data for Xe16O2 by Brock and Schrobilgen. It immediately becomes clear that across the entire stoichiometry range, no structure has vibrational modes in the energy range of the highest measured Raman modes, at 570.3 and 632.3 cm−1. This is despite the fact that the phases that we surveyed cover a wide range of structural motifs (see the Supporting Information (SI) for crystal structure information); for Xe3O2 in particular, we included phases with kinked XeO chains (C2/m), edge-sharing XeO2 chains (Immm), and cornersharing XeO2 chains (P212121). XeO2-Pbca contains extended Xe−O sheets, while XeO-P3121 (the cinnabar structure) contains helical XeO chains. The highest modes associated with Xe−O network vibrations (i.e., excluding the O2 molecular stretch) are found at around 450−470 cm−1 as Xe−O stretch modes in the Xe−O and Xe−O2 chains of various phases, about 25% below the highest experimental frequency. The semilocal PBE functional could plausibly underestimate the vibrational frequencies in these systems; however, for various molecular and crystalline xenon-containing systems, we did not find deviations from experimental or high-level computational data 4338 dx.doi.org/10.1021/jz502230b | J. Phys. Chem. Lett. 2014, 5, 4336−4342 The Journal of Physical Chemistry Letters Letter Figure 5. (Left) Comparison of calculated zone-center phonon modes (diamond symbols) of various Xe−O compounds at P = 1 atm to experimental results (solid red lines);11 ground-state enthalpies of formation are given; open symbols for XeO2 correspond to Raman-active modes. (Right) Crystal structure of XeO2-Pbca at P = 1 atm and a local XeO4 environment; Xe square-planar coordination is indicated as shaded areas. would look for phases that best fit the lower-frequency Raman modes, ignoring the two highest modes. Even so, various phases (and stoichiometries) could fit the experimental data. If the overall stoichiometry is assumed to be indeed XeO2, we want to compare experimental data with the metastable XeO2Pbca phase; it has Raman-active modes at or near most of the experimental Raman modes (the bar for the twin peak at 228/ 239 cm−1). The complete vibrational spectrum is given in Table 1. Due to the presence of two distinct XeO2 sheets in the unit cells, all modes are split into pairs. Raman-active modes at 91/ 103, 195/201, and 297−304 cm−1 correspond well to experimental peaks, with the latter potentially providing an overtone signal at around 600 cm−1. However, other calculated modes at 390/394 and 464/468 cm−1 were not observed in experiment. Calculating the Raman intensities is beyond our computational resources; therefore, a visual analysis of the different modes was performed, which resulted in the assignments given in Table 1. The highest Raman-active modes (464/468 cm−1) correspond to symmetric Xe−O stretches of each XeO4 unit; the modes at 390/394 cm−1 relate to asymmetric Xe−O stretches; the modes at 301/304 and 297/298 cm−1 are librations of XeO4 units within the sheets, roughly around the crystalline a and b axes, respectively; the modes at 195/201 cm−1 are O−Xe−O bends within the XeO4 unit; and the lowest mode pair at 91/103 cm−1 relates to librations of XeO4 units perpendicular to the sheet plane, that is, roughly along the crystalline c axis. We therefore find that the lower-frequency modes seen in experiment agree well with calculated collective motions of the XeO4 units, whereas the highest calculated modes in this Xe−O network structure have much lower frequencies than the highest experimental modes. This discrepancy can certainly not be overcome with a rigid scaling factor, and the search for a structure that features the seemingly required much stiffer Xe−O bonds might have to continue. in excess of 13% of the respective frequencies (see the SI for details). Note that all xenon oxide phases are metastable at P = 1 atm with respect to decomposition into pure xenon and oxygen, as indicated by positive enthalpies of formation in Figure 5. In fact, the proposed XeO2 structure of Pbca symmetry is quite unstable. We cannot rule out that other metastable structures, with lower formation enthalpies, exist. However, XeO2-Pbca is on energetic grounds our best candidate for the phase synthesized by Brock and Schrobilgen, provided that its overall stoichiometry is XeO2. This structure (see Figure 5) would confirm suggestions by the experimental group; it is a Xe−O network structure, with locally quasi-square-planar-coordinated xenon atoms, connected via bent Xe−O−Xe linkages. Globally, the Pbca phase forms stacks of kinked layers of XeO2. The local environment of each xenon atom has lower symmetry (Ci) than suggested by the experimental group (D2h). We arrived at this structure (which is the AgF2 structure type49) by assuming the I4/mmm-XeF2 structure type50,51 for XeO2 and following its dynamical instabilities. Intralayer Xe−O separations are 2.13− 2.2 Å, while shortest interlayer Xe−O separations are 3.43 Å. The Pbca phase has an electronic band gap of 1.7 eV in our hybrid-DFT calculations with the HSE06 functional and hence could well explain the yellow color seen in experiment, which suggests absorption at around 2 eV. It is possible that the highest experimental Raman modes correspond to overtones of fundamental modes (although these have usually an order of magnitude smaller intensity than fundamental modes and therefore may not support this assumption52,53); for instance, the intense mode at 570.3 cm−1 is at almost exactly twice the frequency of the next mode, seen at 283.9 cm−1; that ratio remains close to 2.0 for different oxygen isotopes.11 A similar fundamental mode for the highest observed Raman mode would be located at 316 cm−1; experimental data show a broad shoulder at that frequency. If this were the correct interpretation of the Raman data, we 4339 dx.doi.org/10.1021/jz502230b | J. Phys. Chem. Lett. 2014, 5, 4336−4342 The Journal of Physical Chemistry Letters Letter Table 1. XeO2-Pbca at P = 1 atm with Vibrational Frequencies in cm−1, Their Symmetry and IR/Raman Activity, Their Local Symmetry around Each XeO4 Unit of Ci Symmetry, and Their Assignment involve the Xe−O molecular stretches. The search for the structure by Brock and Schrobilgen might not be finished. ■ COMPUTATIONAL DETAILS We performed density functional theory calculations as implemented in the VASP package using a plane wave basis set (cutoff energy Ec = 600 eV) and the standard projectoraugmented wave (PAW) data sets for the elements to model the electron−ion interaction.54−56 The electron−electron interaction was modeled within the generalized gradient approximation to the exchange−correlation energy functional.57 Brillouin zone integrations were performed on regular grids of k-points with a density of 20 per Å−1 for insulating and 40 per Å−1 for small-gap or metallic systems. Electronic DOSs were evaluated using sufficiently denser k-point grids. We used the evolutionary algorithm approach as implemented in the XtalOpt package58,59 to predict candidate structures of the desired composition at specific pressures (100, 120, and 150 GPa and 2−4 formula units per unit cell) and reoptimized the structures over the pressure range of P = 0−200 GPa until forces on the ions were below 1 meV/Å. Dynamical stability was confirmed using the finite displacement method as implemented in the PHON package.60 ■ ASSOCIATED CONTENT * Supporting Information S Crystal structure information on xenon oxide phases, relative enthalpies of candidate structures as a function of pressure, phonon dispersion, and DOS of various phases, and benchmark calculations of DFT-PBE for vibrational properties of noble gas compounds. This material is available free of charge via the Internet at http://pubs.acs.org. ■ In summary, we have presented results from a computational study on xenon oxides under pressure, concentrating on the xenon-rich side of the binary phase diagram. We find that, on the basis of ground-state enthalpy considerations, the xenon suboxide Xe3O2, in an orthorhombic Immm structure, should be the first xenon oxide compound to be more stable than the elements, at around P = 75 GPa. Other xenon-rich compounds follow to become stable at higher pressures. All of these share the common structural feature of XeO2 chains with intercalated free xenon atoms. Small charge transfer from the free xenon atoms to the XeO2 chains helps stabilize the compounds. Xe3O2 has a very small band gap in its region of stability. Its presence implies that the xenon monoxide, XeO, has no region of stability, but oxygen-rich phases XeOn with n > 1 become stable at higher pressures. An attempt was then made to use the plethora of Xe−O structures now available to assign a structure to a recently synthesized metastable xenon−oxygen compound. Several phases and stoichiometries were found to give equally dissatisfying comparisons to the Raman data, most notably the absence of any modes above 470 cm−1, which, even with allowance for deficiencies in the DFT methodology used, seems curious. Following the experimental assumptions about the structure’s stoichiometry (XeO2), our best candidate on energetic grounds confirms the proposed local Xe−O network connectivity; it is a layered structure of stacked XeO2 sheets and has a band gap in the visible region, in agreement with experiment. While it can describe the low-frequency part of the experimental Raman data, there are discrepancies between the highest calculated and experimental modes, which should AUTHOR INFORMATION Corresponding Author *E-mail: a.hermann@ed.ac.uk. Notes The authors declare no competing financial interest. ■ ACKNOWLEDGMENTS Computational resources provided by the U.K. National Supercomputing Service through the UKCP consortium and funded by EPSRC Grant EP/K013564/1 are gratefully acknowledged. ■ REFERENCES (1) Bartlett, N. Xenon Hexafluoroplatinate(V) Xe+[PtF6]−. Proc. Chem. Soc. 1962, 1962, 218. (2) Claassen, H. H.; Selig, H.; Malm, J. G. Xenon Tetrafluoride. J. Am. Chem. Soc. 1962, 84, 3593−3593. (3) Chernick, C. L.; et al. Fluorine Compounds of Xenon and Radon. Science 1962, 138, 136−138. (4) Claassen, H. H.; Chernick, C. L.; Malm, J. G. Vibrational Spectra and Structure of Xenon Tetrafluoride. J. Am. Chem. Soc. 1963, 85, 1927−1928. (5) Malm, J. G.; Sheft, I.; Chernick, C. L. Xenon Hexafluoride. J. Am. Chem. Soc. 1963, 85, 110−111. (6) Weaver, E. E.; Weinstock, B.; Knop, C. P. Xenon Hexafluoride. J. Am. Chem. Soc. 1963, 85, 111−112. (7) Smith, D. F. Xenon Trioxide. J. Am. Chem. Soc. 1963, 85, 816− 817. (8) Templeton, D. H.; Zalkin, A.; Forrester, J. D.; Williamson, S. M. Crystal and Molecular Structure of Xenon Trioxide. J. Am. Chem. Soc. 1963, 85, 817−817. 4340 dx.doi.org/10.1021/jz502230b | J. Phys. Chem. Lett. 2014, 5, 4336−4342 The Journal of Physical Chemistry Letters Letter (9) Huston, J. L.; Studier, M. H.; Sloth, E. N. Xenon Tetroxide: Mass Spectrum. Science 1964, 143, 1161−1162. (10) Selig, H.; Claassen, H. H.; Chernick, C. L.; Malm, J. G.; Huston, J. L. Xenon Tetroxide: Preparation and Some Properties. Science 1964, 143, 1322−1323. (11) Brock, D. S.; Schrobilgen, G. J. Synthesis of the Missing Oxide of Xenon, XeO2, and Its Implications for Earth’s Missing Xenon. J. Am. Chem. Soc. 2011, 133, 6265−6269. (12) Zhu, Q.; Jung, D. Y.; Oganov, A. R.; Glass, C. W.; Gatti, C.; Lyakhov, A. O. Stability of Xenon Oxides at High Pressures. Nat. Chem. 2013, 5, 61−65. (13) Anders, E.; Owen, T. Mars and Earth: Origin and Abundance of Volatiles. Science 1977, 198, 453−465. (14) Tolstikhin, I. N.; O’Nions, R. K. The Earth’s Missing Xenon: A Combination of Early Degassing and of Rare Gas Loss from the Atmosphere. Chem. Geol. 1994, 115, 1−6. (15) Pepin, R. O.; Porcelli, D. Origin of Noble Gases in the Terrestrial Planets. Rev. Mineral. Geochem. 2002, 47, 191−246. (16) Matsuda, J.-i.; Matsubara, K. Noble Gases in Silica and Their Implication for the Terrestrial “Missing” Xe. Geophys. Res. Lett. 1989, 16, 81−84. (17) Ozima, M. Noble Gases Under Pressure in the Mantle. Nature 1998, 393, 303−304. (18) Sanloup, C.; Schmidt, B. C.; Chamorro Perez, E. M.; Jambon, A.; Gregoryanz, E.; Mezouar, M. Retention of Xenon in Quartz and Earth’s Missing Xenon. Science 2005, 310, 1174−1177. (19) Probert, M. I. J. An Ab Initio Study of Xenon Retention in αQuartz. J. Phys.: Condens. Matter 2010, 22, 025501. (20) Zhu, L.; Liu, H.; Pickard, C. J.; Zou, G.; Ma, Y. Reactions of Xenon with Iron and Nickel are Predicted in the Earth’s Inner Core. Nat. Chem. 2014, 6, 644−648. (21) Grochala, W. Atypical Compounds of Gases, Which Have Been Called ‘Noble’. Chem. Soc. Rev. 2007, 36, 1632−1655. (22) Somayazulu, M.; Dera, P.; Goncharov, A. F.; Gramsch, S. A.; Liermann, P.; Yang, W.; Liu, Z.; Mao, H.-K.; Hemley, R. J. PressureInduced Bonding and Compound Formation in Xenon−Hydrogen Solids. Nat. Chem. 2010, 2, 50−53. (23) Sanloup, C.; Bonev, S. A.; Hochlaf, M.; Maynard-Casely, H. E. Reactivity of Xenon with Ice at Planetary Conditions. Phys. Rev. Lett. 2013, 110, 265501. (24) Seoung, D.; Lee, Y.; Cynn, H.; Park, C.; Choi, K.-Y.; Blom, D. A.; Evans, W. J.; Kao, C.-C.; Vogt, T.; Lee, Y. Irreversible Xenon Insertion into a Small-Pore Zeolite at Moderate Pressures and Temperatures. Nat. Chem. 2014, 6, 835−839. (25) Oganov, A. R.; Lyakhov, A. O.; Valle, M. How Evolutionary Crystal Structure Prediction Worksand Why. Acc. Chem. Res. 2011, 44, 227−237. (26) Hermann, A.; Ashcroft, N. W.; Hoffmann, R. High Pressure Ices. Proc. Natl. Acad. Sci. U.S.A. 2012, 109, 745−750. (27) Hermann, A.; McSorley, A.; Ashcroft, N. W.; Hoffmann, R. From Wade−Mingos to Zintl−Klemm at 100 GPa: Binary compounds Cf Boron and Lithium. J. Am. Chem. Soc. 2012, 134, 18606. (28) Zurek, E.; Hoffmann, R.; Ashcroft, N. W.; Oganov, A. R.; Lyakhov, A. O. A Little Bit of Lithium Does a Lot for Hydrogen. Proc. Natl. Acad. Sci. U.S.A. 2009, 106, 17640−17643. (29) Wang, H.; Tse, J. S.; Tanaka, K.; Iitaka, T.; Ma, Y. Superconductive Sodalite-Like Clathrate Calcium Hydride at High Pressures. Proc. Natl. Acad. Sci. U.S.A. 2012, 109, 6463−6466. (30) Lonie, D. C.; Hooper, J.; Altintas, B.; Zurek, E. Metallization of Magnesium Polyhydrides under Pressure. Phys. Rev. B 2013, 87, 054107. (31) Wang, Y.; Lv, J.; Zhu, L.; Ma, Y. CALYPSO: A Method for Crystal Structure Prediction. Comput. Phys. Commun. 2012, 183, 2063−2070. (32) Pickard, C. J.; Needs, R. J. Ab Initio Random Structure Searching. J. Phys.: Condens. Matter 2011, 23, 053201. (33) Ma, Y.; Eremets, M.; Oganov, A. R.; Xie, Y.; Trojan, I.; Medvedev, S.; Lyakhov, A. O.; Valle, M.; Prakapenka, V. Transparent Dense Sodium. Nature 2009, 458, 182−185. (34) Zhang, W.; Oganov, A. R.; Goncharov, A. F.; Zhu, Q.; Boulfelfel, S. E.; Lyakhov, A. O.; Stavrou, E.; Somayazulu, M.; Prakapenka, V. B.; Konôpková, Z. Unexpected Stable Stoichiometries of Sodium Chlorides. Science 2013, 342, 1502−1505. (35) Palasyuk, T.; Troyan, I.; Eremets, M.; Drozd, V.; Medvedev, S.; Zaleski-Ejgierd, P.; Magos-Palasyuk, E.; Wang, H.; Bonev, S. A.; Dudenko, D.; Naumov, P. Ammonia as a Case Study for the Spontaneous Ionization of a Simple Hydrogen-Bonded Compound. Nat. Commun. 2014, 5, 3460. (36) Hermann, A.; Ashcroft, N. W.; Hoffmann, R. Binary Compounds of Boron and Beryllium: A Rich Structural Arena with Space for Predictions. Chem.Eur. J. 2013, 19, 4184−4197. (37) Brock, D. S.; Bilir, V.; Mercier, H. P. A.; Schrobilgen, G. J. XeOF2, F2OXeNCCH3, and XeOF2·nHF: Rare Examples of Xe(IV) Oxide Fluorides. J. Am. Chem. Soc. 2007, 129, 3598−3611. (38) Tracy, J. W.; Gregory, N. W.; Lingafelter, E. C. Crystal Structure of Chromium(II) Bromide. Acta Crystallogr. 1962, 15, 672. (39) Vest, B.; Hermann, A.; Boyd, P. D. W.; Schwerdtfeger, P. Nucleation of Antiferromagnetically Coupled Chromium Dihalides: From Small Clusters to the Solid State. Inorg. Chem. 2010, 49, 3169− 3182. (40) Tsai, K.-R.; Harris, P. M.; Lassettre, E. N. The Crystal Structure of Tricesium Monoxide. J. Phys. Chem. 1956, 60, 345−347. (41) Rauch, P. E.; Simon, A. The New Subnitride NaBa3N; an Extension of Alkali Metal Suboxide Chemistry. Angew. Chem., Int. Ed. 1992, 31, 1519−1521. (42) Simon, A. Group 1 and 2 Suboxides and Subnitrides Metals with Atomic Size Holes and Tunnels. Coord. Chem. Rev. 1997, 163, 253−270. (43) Bader, R. F. W. Atoms in Molecules: A Quantum Theory; Oxford University Press: Oxford, U.K., 1994. (44) Seidel, S.; Seppelt, K. Xenon as a Complex Ligand: The Tetra Xenono Gold(II) Cation in AuXe42+(Sb2F11−)2. Science 2000, 290, 117−118. (45) Hwang, I.-C.; Seidel, S.; Seppelt, K. Gold(I) and Mercury(II) Xenon Complexes. Angew. Chem., Int. Ed. 2003, 42, 4392−4395. (46) Cooke, S. A.; Gerry, M. C. L. XeAuF. J. Am. Chem. Soc. 2004, 126, 17000−17008. (47) Becke, A. D.; Edgecombe, K. E. A Simple Measure of Electron Localization in Atomic and Molecular Systems. J. Chem. Phys. 1990, 92, 5397−5403. (48) Heyd, J.; Scuseria, G. E.; Ernzerhof, M. Erratum: “Hybrid Functionals Based on a Screened Coulomb Potential”. J. Chem. Phys. 2003, 118, 8207; J. Chem. Phys. 2006, 124, 219906. (49) Fischer, P.; Schwarzenbach, D.; Rietveld, H. M. Crystal and Magnetic Structure of Silver Difluoride. J. Phys. Chem. Solids 1971, 32, 543−550. (50) Siegel, S.; Gebert, E. Crystallographic Studies of XeF2 and XeF4. J. Am. Chem. Soc. 1963, 85, 240−240. (51) Levy, H. A.; Agron, P. A. The Crystal and Molecular Structure of Xenon Difluoride by Neutron Diffraction. J. Am. Chem. Soc. 1963, 85, 241−242. (52) Domingo, C.; Escribano, R.; Murphy, W. F.; Montero, S. Raman Intensities of Overtones and Combination Bands of C2H2, C2HD, and C2D2. J. Chem. Phys. 1982, 77, 4353−4359. (53) Kono, H.; Lin, S. H. Resonance Raman Overtone Intensity Calculations of a Matrix-Isolated I2 Molecule by the Symmetrized Split Operator Fast Fourier Transform Method. J. Chem. Phys. 1986, 84, 1071−1079. (54) Kresse, G.; Furthmüller, J. Efficient Iterative Schemes for Ab Initio Total-Energy Calculations Using a Plane-Wave Basis Set. Phys. Rev. B 1996, 54, 11169−11186. (55) Blöchl, P. E. Projector Augmented-Wave Method. Phys. Rev. B 1994, 50, 17953−17979. (56) Kresse, G.; Joubert, D. From Ultrasoft Pseudopotentials to the Projector Augmented-Wave Method. Phys. Rev. B 1999, 59, 1758− 1775. (57) Perdew, J. P.; Burke, K.; Ernzerhof, M. Generalized Gradient Expansion Made Simple. Phys. Rev. Lett. 1996, 77, 3865−3868. 4341 dx.doi.org/10.1021/jz502230b | J. Phys. Chem. Lett. 2014, 5, 4336−4342 The Journal of Physical Chemistry Letters Letter (58) Lonie, D. C.; Zurek, E. XtalOpt: An Open-Source Evolutionary Algorithm for Crystal Structure Prediction. Comput. Phys. Commun. 2011, 182, 372−387. (59) Lonie, D. C.; Zurek, E. Identifying Duplicate Crystal Structures: XtalComp, an Open-Source Solution. Comput. Phys. Commun. 2012, 183, 690−697. (60) Alfè, D. PHON: A Program to Calculate Phonons Using the Small Displacement Method. Comput. Phys. Commun. 2009, 180, 2622−2633. 4342 dx.doi.org/10.1021/jz502230b | J. Phys. Chem. Lett. 2014, 5, 4336−4342
