Physics Kinematics Worksheet: Velocity, Acceleration, Displacement
advertisement
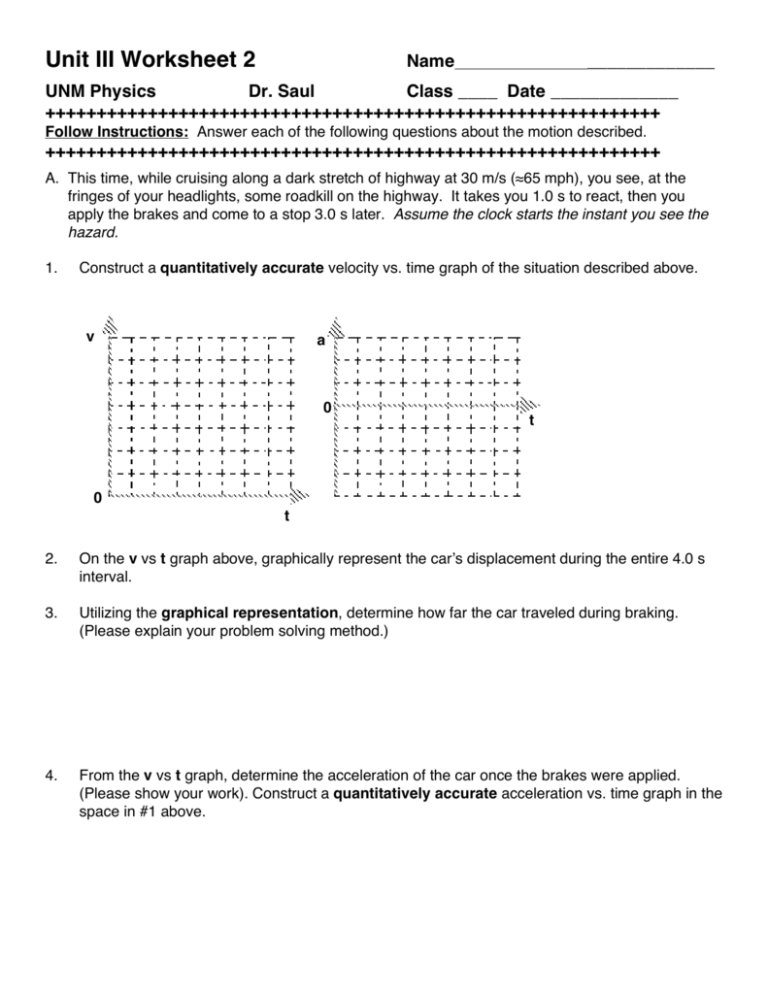
Unit III Worksheet 2 Name _____________ UNM Physics Dr. Saul Class ____ Date _____________ ++++++++++++++++++++++++++++++++++++++++++++++++++++++++++++ Follow Instructions: Answer each of the following questions about the motion described. ++++++++++++++++++++++++++++++++++++++++++++++++++++++++++++ A. This time, while cruising along a dark stretch of highway at 30 m/s (≈65 mph), you see, at the fringes of your headlights, some roadkill on the highway. It takes you 1.0 s to react, then you apply the brakes and come to a stop 3.0 s later. Assume the clock starts the instant you see the hazard. 1. Construct a quantitatively accurate velocity vs. time graph of the situation described above. v a 0 t 0 t 2. On the v vs t graph above, graphically represent the carʼs displacement during the entire 4.0 s interval. 3. Utilizing the graphical representation, determine how far the car traveled during braking. (Please explain your problem solving method.) 4. From the v vs t graph, determine the acceleration of the car once the brakes were applied. (Please show your work). Construct a quantitatively accurate acceleration vs. time graph in the space in #1 above. 5. Two kinds of motion occur in this case. For the first 1.0 s, the car is traveling at constant velocity. For the remainder of the time, the car has an initial velocity and a uniform acceleration. Using the appropriate mathematical representation (equation) for each phase of the motion, determine how far the car traveled from the instant you noticed the hazard until you came to a stop. As always, show work and include units. 6. Construct a table and a motion map that represents the motion described above, including position, velocity, and acceleration. Make your arrows on both motion maps half scale. t (s) x (m) v (m/s) a (m/s2) B. A stunt car driver testing the use of air bags drives a car at a constant speed of 25 m/s for a total of 100. m. He applies his brakes and accelerates uniformly to a stop just as he reaches a wall 50. m away. a. Sketch qualitative position vs. time and velocity vs time graphs. b. How long does it take for the car to travel the first 100.m? c. Remember that the area under a velocity vs time graph equals the displacement of the car. How long must the brakes be applied for the car to come to a stop in 50 m? d. Now that you know the total time of travel, sketch a quantitative velocity vs time graph. e. What acceleration is provided by the brakes? How do you know?
